Performance is a concern for all but the most trivial of applications, and in a constrained environment like the phone it is all the more so; performance issues directly manifest themselves in the user experience. Memory usage is one such source of performance issues that can degrade user experience, and the Windows Phone Marketplace enforces a technical certification requirement that an application must not exceed 90 MB of RAM usage, except on devices that have more than 256 MB of memory.
What could cause 90 MB of usage in a garbage-collected runtime? There could be several causes:
- Allocating too much.
- Long living objects that bloat working set.
- Holding on to references unintentionally leading to memory leaks.
Applications allocating too much could end up with working sets breaching this threshold; applications with a large working set might eventually exit with an “Out of Memory” exception; and holding on to references unintentionally can lead to memory leaks causing working set to increase steadily and stealthily, eventually leading to the application exiting with an “Out of Memory” exception.
Up until the Windows Phone SDK 7.1 release, application developers had to guard against this by programmatically instrumenting their code with specific framework method calls and track memory usage. These methods included the following:
- System.GC.GetTotalMemory
- Microsoft.Phone.Info.DeviceExtendedProperties.DeviceTotalMemory
- Microsoft.Phone.Info.DeviceExtendedProperties.ApplicationCurrentMemoryUsage
- Microsoft.Phone.Info.DeviceExtendedProperties.ApplicationPeakMemoryUsage
But beyond that there was little help from the tools.
The Windows Phone SDK 7.1 addresses this through the introduction to profiling tools to analyze the execution, visual, and memory characteristics of an application.
Install the SDK now, and let us walk through the Memory Profiler as we investigate a case of a memory leak caused by unintentionally holding on to references.
A Sample Application
Consider this application that has two pages, and where the second page renders several images within a grid, and where one may navigate between pages.
Page2 has 4 images controls within a grid control that is bitmapcached. During the initialization of Page2, it binds the 4 image controls to jpeg images and registers for an event handler.
The two pages look as follows:
As we try out the application going back and forth between the pages a few times, observe that memory usage keeps going up; there is a memory leak.
Visualizing the leak
To delve deeper into this leak further let us run this application through the Memory Profiler using the following steps:
- Invoke the Profiler, choose “Memory (managed object allocation and texture usage)”, and launch the application. Note the memory used by the application at the top of the screen.
- Click on Go To Page2. This will launch Page2, and display the 4 flower images.
- Click on the back button.
- Click on ‘Force GC’. Note the memory used by the application at the top of the screen. Observe that it does not go down.
- Repeat steps 2, 3, 4 four more times.
- Now click on ‘Stop Profiling’.
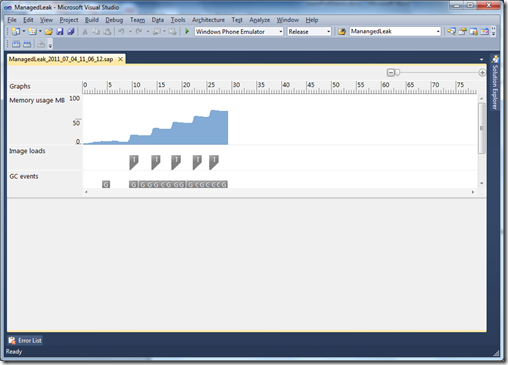
We should see a graph like the following:
As expected memory usage is steadily growing.
Analysis
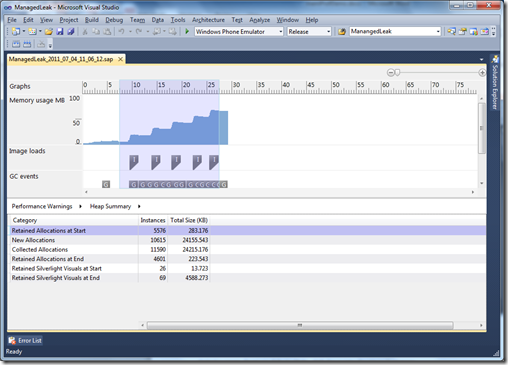
Select a range, from before the start of the first plateau to just after the after the start of the last plateau, for analysis. Once analysis is complete, using Performance Warnings as the starting point, navigate to the Heap Summary view. We should see a table similar to the following:
Note that the memory held by Retained Silverlight Visuals at End is large as compared to that held by just managed objects. So, let’s drill down into these retained Silverlight visuals.
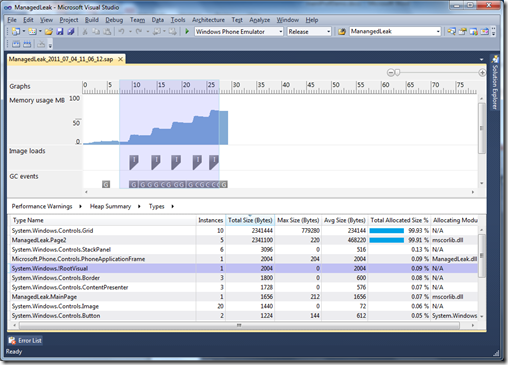
Select Retained Silverlight Visuals at End and navigate to the Types view. In the Types view, sort the Total Size (Bytes) column in descending order. We should now see a table similar to the following:
Note that Grid and Page2 are the heavy consumers. We also notice right away that 5 instances of Page2 are hanging around. In our scenario, we navigated 5 times to Page2, remember?
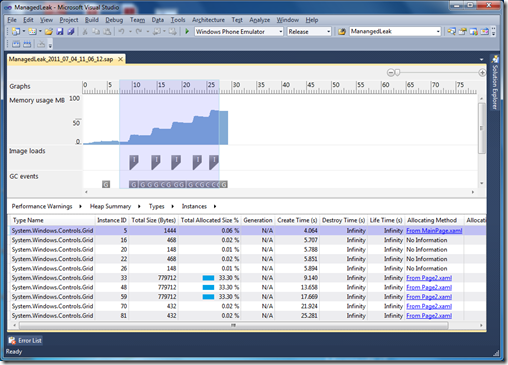
Let’s look at what those 10 instances of the Grid are: click on the Grid and navigate to the Instances view. We should now see a table similar to the following:
Note that 5 of the instances are being allocated from Page2. Click on the hyperlink and you can go the line of code in XAML where the Grid is allocated.
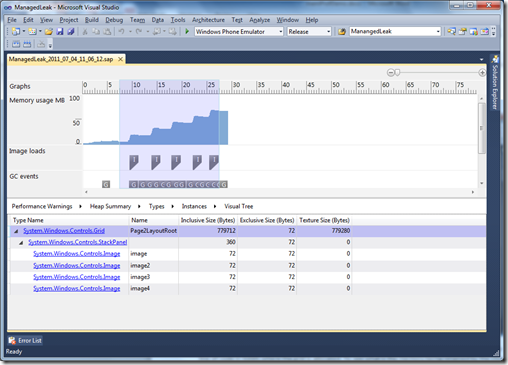
To see what is the memory being retained by the visual tree rooted at a Grid instance, click on, say, the grid with the ID 33 (this is a grid allocated from Page2), and navigate to the Visual Tree view. We should now a table similar to the following:
Note the visual tree rooted at that grid instance. We can see the 4 contained image controls, as well as the Texture memory associated with the grid.
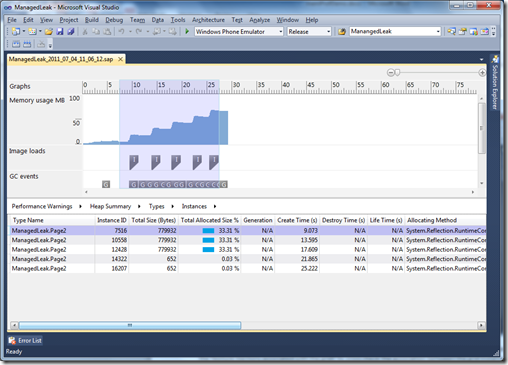
To cross check the association between the grid instance and Page2, we can go back to the Types view, select Page2, and navigate to the Instances view. We should then see a table similar to the following:
Notice that there are 5 instances created and none of them has been destroyed (i.e. garbage collected).
Now let’s look at the Visual Tree rooted at a Page2 instance. Select the first instance, and navigate to the Visual Tree. We should see a table similar to the following:
Again, we see the grid, its associated texture memory, and its contained image controls. Earlier we saw that 5 instances of Page2 were hanging around. That leak was causing the associated grid, images, and texture memory to not get cleaned up.
Now let us see why the Page2 instances were hanging around.
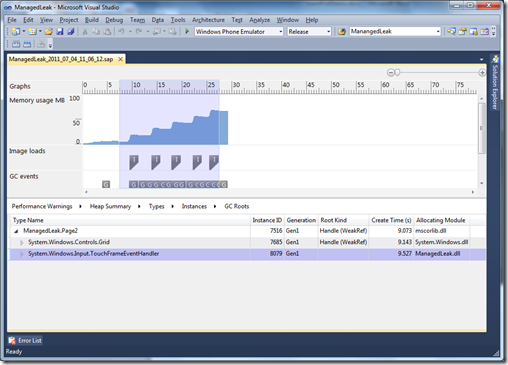
Go back to the Instances view, select the first Page2 instance, and navigate to the GC Roots view. Collapse the tree structures. We should see a table similar to the following:
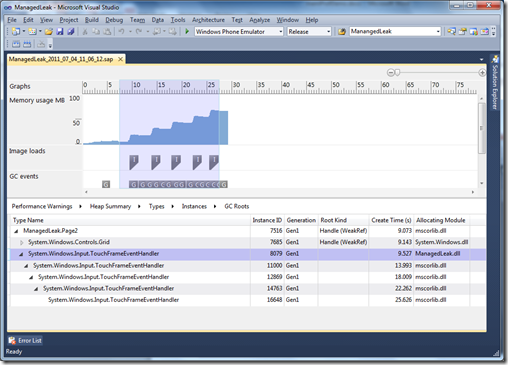
Ignore the weak references (these do not prevent the GC from acting on the references). But look at the TouchFrameEventHandler; expand it and we should see a table similar to the following:
There are 5 chained event handlers! The first one was allocated from our assembly. The rest were cloned within mscorlib, as each page appended its own TouchFrameEventHandler (the event handler is implemented as a .Net Delegate type). That event handler is holding a reference to the page that in turn is preventing the page from being garbage collected.
So the eventhandlers references the Page2 instances, preventing it from being GC’d; and thus assets contained in Page2 are not cleaned up (the grid, associated texture memory, images).
Solved!
All that remains to be done is to find where that handler is being registered in our assembly.
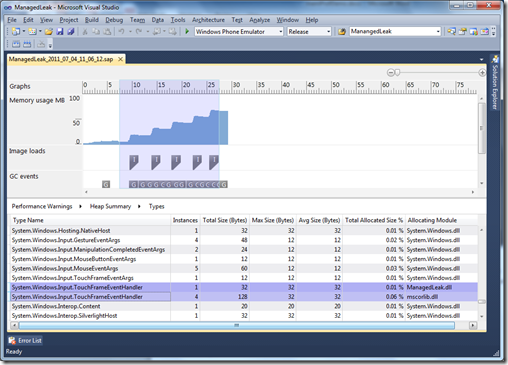
Go back to Heap Summary, select Retained Allocations at End, navigate to the Types view, sort by Type Name column, and scroll down to locate the TouchFrameEventHandler. We should see the following:
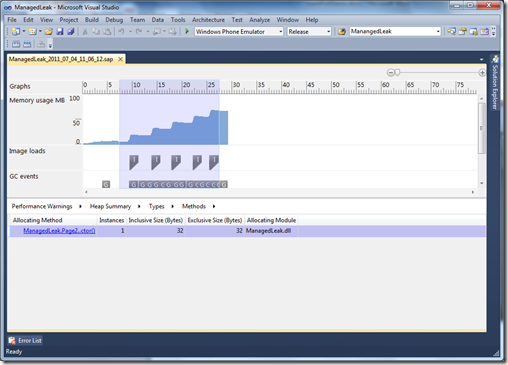
To find out where that 1 instance was allocated in our application code, select the first entry, and navigate to the Methods view. You should see the following:
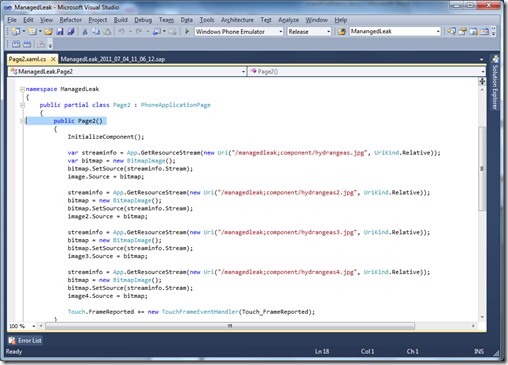
Click on the Allocating Method hyperlink, and you will jump to the method that did the allocation. You should see the following:
There, right at the bottom is the place where we register to the eventhandler! The step of registering stashes away a strong reference to this instance of the page within the event handler delegate. Unless the user unregisters this handler, the Page2 instance will remain alive (and consequently so too will the grid and the images, and the texture memory will not get cleaned up).
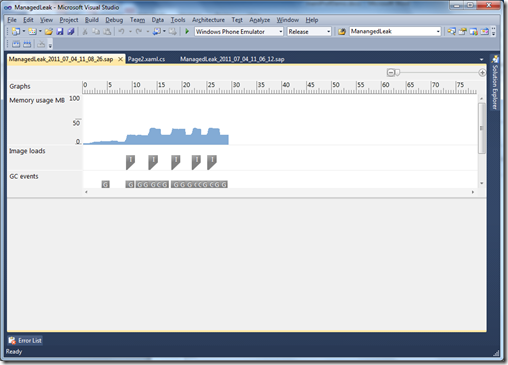
If you comment out the line that enregisters the handler, and rerun this scenario, here is the graph you would see:
Voilà!
Conclusion
Having a garbage collected runtime removes one of the biggest sources of program errors, memory allocation errors; you no longer have to worry about freeing memory which you no longer use. But leaks spring when you unintentionally hold on to object references that you no longer use. By providing a variety of Views on the applications memory usage the Memory Profiler can be a valuable tool to detect and fix such leaks.


