[Performance is a key concern for all but the most trivial of apps, and memory usage helps determine how well your app runs. In this series, Pratap Lakshman shows how the Windows Phone Performance Analysis Tool can help you diagnose and fix memory issues and improve app performance. –ed.]
In today’s tutorial on the Windows Phone Performance Analysis tool, I’m focusing on the Object Graph view, which shows the graph of objects that are reachable from any instance of an object.
It can be helpful to think of the object graph as a set of connected object instances—the nodes are the object instances and the edges are the references between the instances. The garbage collector (GC) uses the object graph to determine instances in memory that are still reachable, that is, that are live and referenced by others. The instances might be needed by the program, or they might be no longer reachable and therefore can be determined to be eligible for garbage collection. The object graph also is useful to the developer who wants to answer questions like “what other objects are being kept alive because of this particular instance?” and ”what is the amount of memory being used by the object graph rooted at this particular instance?” to help improve their app’s performance.
Computing the object graph
At any given point in time, there can be a large number of live object instances on the heap. We know that the intrusion to trace out the object graph that is reachable from each object instance can be time consuming; it adds to the size of the profile data that needs to be logged; it potentially can be wasteful (what if the instance for which the object graph was computed got garbage collected?); and it can significantly disrupt runtime performance. Consequently, the profiler computes object graphs only after a “full” GC (when the heap contents are comparatively stable), or after at least five GCs have occurred. That is, the profiler computes object graphs at a low frequency of intrusion. Five GCs is just the default and can be tuned in the Advanced Settings hive in the launch page. The following code snippet from the sample illustrates how information in the Object Graph view is represented.
A sample and the object graph
This sample app builds up a set of instances that are connected in various configurations: a cycle, a doubly linked list, and a double diamond. Consider the case of the cycle, as follows:
   public class Element {
        public Element next;
    }

    public class Cycle {
        public static Element m_e;

        public Cycle() {
            m_e = new Element();
            var e = new Element();
            m_e.next = e;
            e.next = m_e;
        }
    }
    ...
    var c = new Cycle();
    GC.Collect();
To keep the sample brief, we explicitly trigger a full GC after creating the cycle, which cues the profiler to compute the object graph.
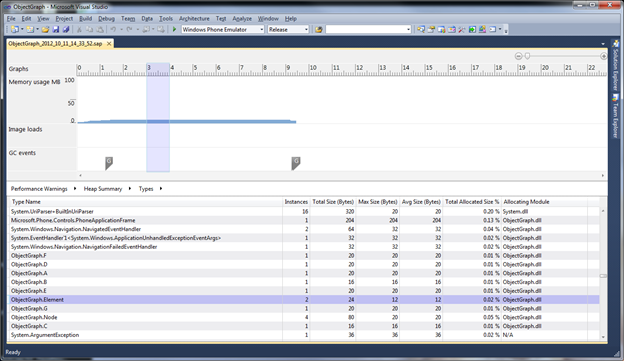
The cycle of instances of Element, reachable from the static field m e, survives the garbage collection. If we select a time range after this (first) GC, and go to the Types view via the Retained Allocations category, we see two instances of the type Element as expected.
If we go to the Instances view, we see those two instances:
At this stage we can inspect the object graph that’s reachable from either instance. If we select the older instance (ID 4347) and navigate to the Object Graph view we see the following table:
Although most of the information is similar to the info in the Instances view, note the following: (1) the indentation in the Type Name column, (2) the asterisk at the end of certain Type Name entries, and (3) the Reference Count column.
The indentation indicates the referent. In this case, the Element with ID 4347 refers to the Element with ID 4348, and that 4348 in turns refers to 4347. During the profiler’s discovery of this graph, 4347 has been visited more than once, so forming a cycle with its referent. This is indicated with an asterisk at the end of the Type Name for that particular instance; no further paths through that instance will be expanded. Finally, the number of references (Reference Count) to each of the instances is one. This topology can be represented as follows:
We can apply this interpretation to a couple more examples.
Another example: doubly linked list
Consider the following snippet, which builds a double linked list of four Node instances.
    public class Node {
        public int val;
        public Node prev;
        public Node next;

        public Node(int i) {
            val = i;
            prev = null;
            next = null;
        }
    }

    class DoublyLinkedList {
        // Roots for the list
        public static Node head = null;
        public static Node tail = null;

        public void add(Node n) {
            if (head == null) {
                head = n;
                tail = n;
            }
            else {
                tail.next = n;
                n.prev = tail;
                tail = n;
            }
        }

        public DoublyLinkedList() {
            for (int i = 0; i < 4; i++) {
                add(new Node(i));
            }
        }
    }
    ...
    var dll = new DoublyLinkedList();
    GC.Collect();
If we go to the Types view via the Retained Allocations category we see four instances of the type Node as expected:
The Instances view shows the four instances:
If we go to the Object Graph view, we see the objects reachable from the instance 4334:
If we collapse the entire hierarchy starting at the first row in the table and then expand it one row at a time, we can apply the same interpretation as in the cycle example, and we see a topology that maps to the following image:
Notice the following:
- The referents start from 4335. This is represented by the indentation in the Type Name column.
- Instance 4334, 4335, and 4336 form a cycle with their referents. At corresponding positions in the referent hierarchy, this is indicated with an asterisk at the end of their Type Name, and no further paths through them are expanded.
- Both instances 4335 and 4336 have two references pointing at them. This is reflected with a count of 2 in the Reference Count column.
A more complex example: double diamond
Let’s consider one more example. This time we’ll take a look at instances connected in a double diamond formation.
public class A { public B b; public C c; public int val;}
    public class B { public D d; public int val;}
    public class C { public D d; public int val;}
    public class D { public E e; public F f; public int val;}
    public class E { public G g; public F f; public int val;}
    public class F { public G g; public F f; public int val;}
    public class G { public G g; public F f; public int val;}

    class DoubleDiamond {
        // root for the diamonds.
        public static A a;

        public DoubleDiamond() {
            a = new A();
            a.b = new B();
            a.c = new C();
            a.b.d = new D();
            a.c.d = a.b.d;
            a.b.d.e = new E();
            a.b.d.f = new F();
            a.b.d.e.g = new G();
            a.b.d.f.g = a.b.d.e.g;
        }
    }
    ...
    var dd = new DoubleDiamond();
    GC.Collect();
If we go to the Types view via the Retained Allocations category, we see each of the instances of the types as expected:
The Instances view for type A shows its single instance:
When we go to the Object Graph view, we see all the objects reachable from that instance:
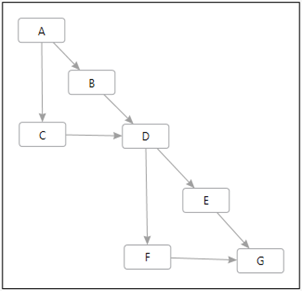
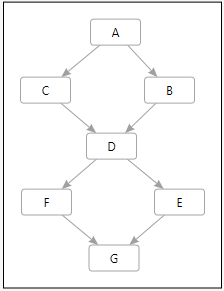
As before, if we collapse the entire hierarchy starting at the first row in the table and then expand it one row at a time, we can apply the same interpretation as in the previous cases and see a topology that maps to the following images:
Notice the following:
- The referents start from B (4340). This is represented by the indentation in the Type Name column.
- There’s more than one path leading up to D (4342) and G (4345). At corresponding positions in the referent hierarchy, this is indicated with an asterisk at the end of their Type Name, and no further paths through them are expanded.
- A has a reference count of 0 (there are no references pointing to it in this graph), both D and G have two references pointing to them, and the others have only one reference pointing to them. This is reflected by the counts in the Reference Count column.
Conclusion
The Object Graph view reports the graph of objects that are reachable from any particular object instance, and helps the developer visualize their connectivity. We can use this view to evaluate the consequence of any single instance being retained in memory, that is, consider object lifetimes in the context of the garbage-collected runtime. In a subsequent post that will conclude this series we will look at how to determine why an instance remains a live object.
This series shows you how to take advantage of the memory profiling feature of the Windows Phone Performance Analysis Tool. Related posts:


