

In January this year, we described new features and experiences for developers in the F12 developer tools that enable you to be more effective with a range of updates (e.g. new performance and network tools as well as Debugger enhancements and UI improvements.
The latest Windows 10 Insider Preview brings more improvements, including a refined network tool experience and an early look into the tooling support that will be available for Microsoft Edge.
Microsoft Edge F12 developer tools
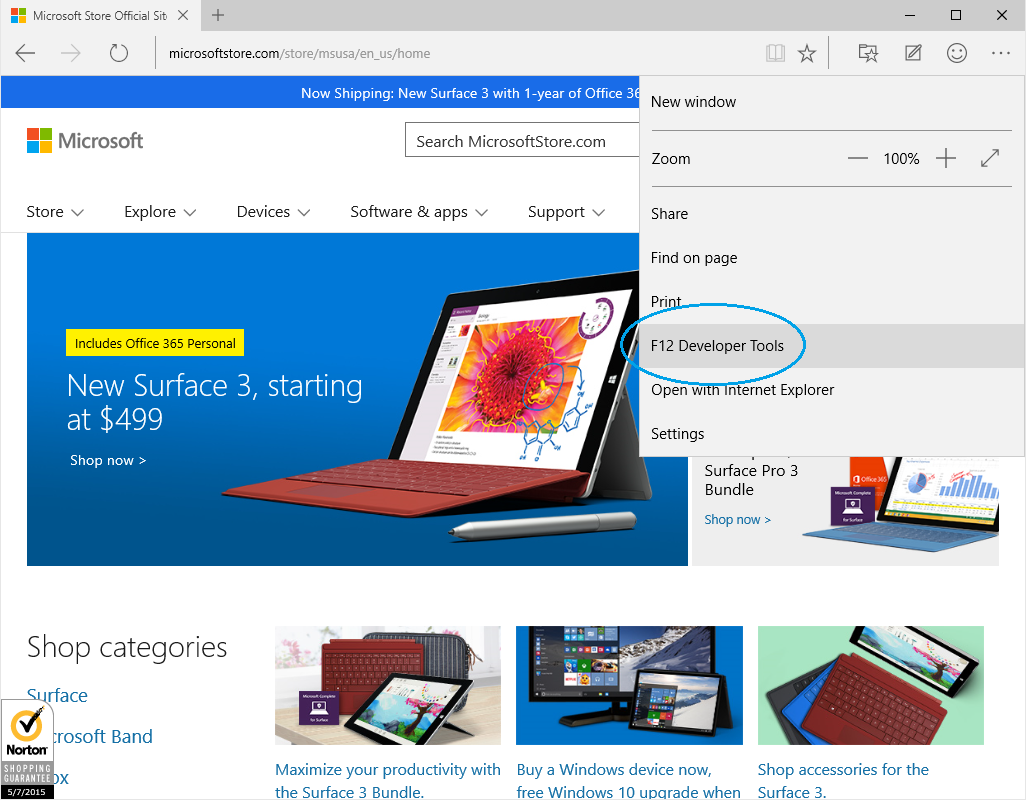
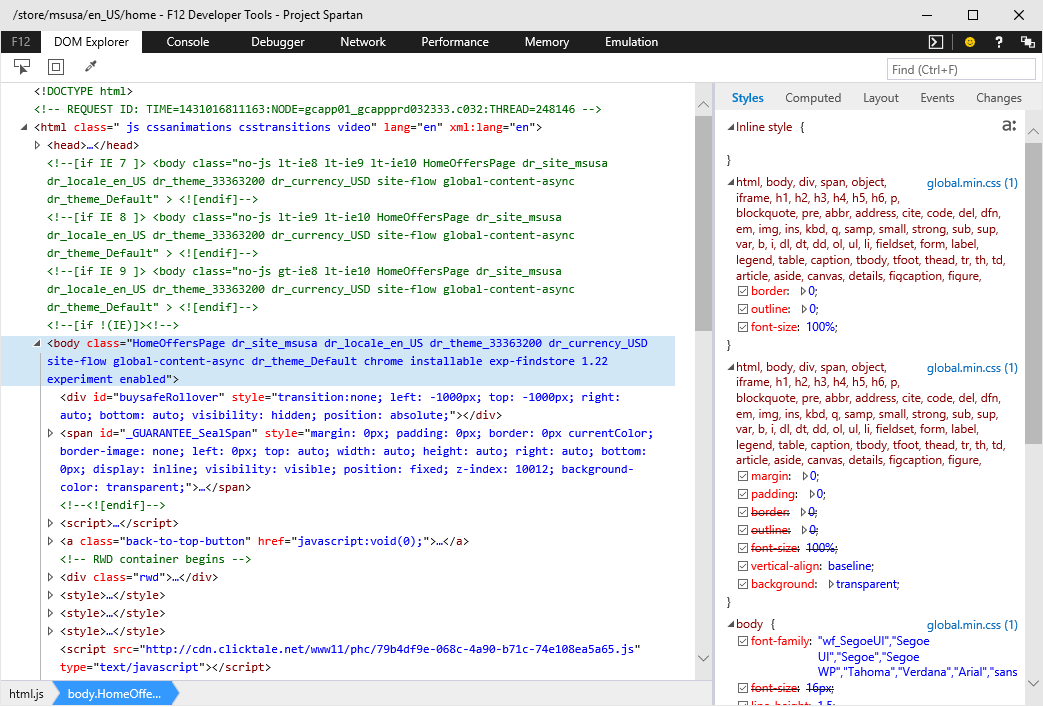
To access the Microsoft Edge F12 developer tools, open the settings menu and select “F12 Developer tools,” which will launch the tools undocked.
Network tool
We’ve heard feedback from developers regarding the network tool’s capabilities and ease of use. Some examples include the lack of auto-start capturing, export to JSON HAR, and filtering. To address this feedback, we’ve been working to redesign the network tool to provide a cleaner experience that makes you more productive when identifying and resolving network related issues.
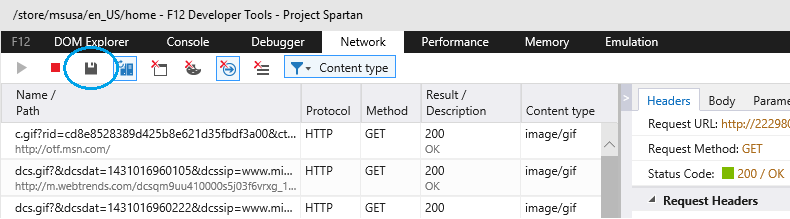
Network issues can appear at any time from the initial page request, to loading and interacting with the app. It’s therefore important that the tool allows you to collect network HTTP-based traffic without the need to start a capturing session (e.g. issues might occur between page requests, loading and interacting with the page). Per your feedback, we also added the Start & Stop toolbar buttons to give you the flexibility to manage your session.

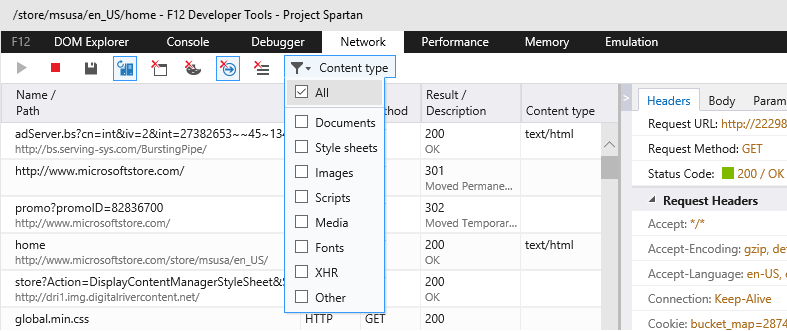
The toolbar gives you the power to zero-in quickly on specific types of traffic (for example, an image may not be displayed or you may not be getting the latest version of an image) by filtering out all unrelated content. The “Content type filter” toolbar button supports multiple filters that allow you to become more productive by skipping over dozens of unrelated network calls and only focusing on the relevant ones.
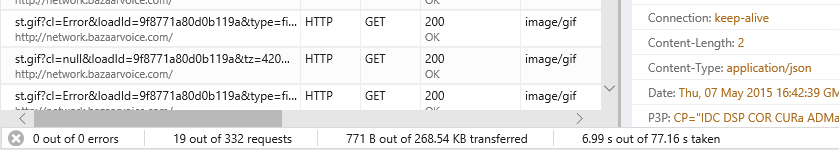
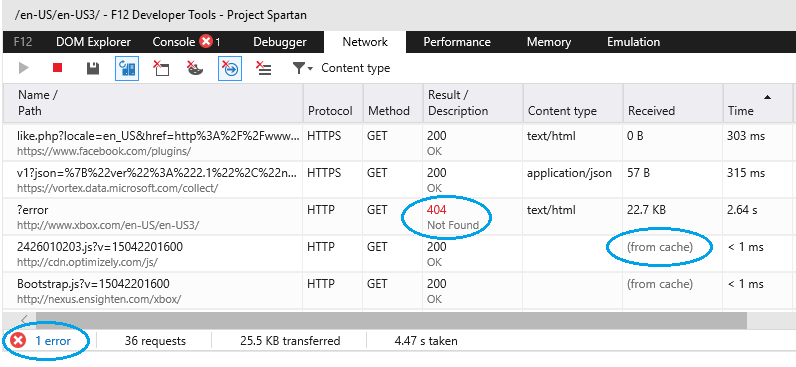
Once a filter is applied, the status bar at the bottom of the tool will reflect the captured network traffic currently displayed in the summary view. At a glance, it provides information about network errors (responses with 4xx or 5xx status codes), the number of requests, how much response data was transferred from the server, and how long it took to download. This is helpful when measuring how much data was consumed in a particular scenario or trying to better understand how long it might take to download certain resources.
There are cases where you might want to share your network traffic log with other developers or use tools like Fiddler to run a performance analysis session. For these, you can use the export button to export the captured network traffic into a JSON HAR file.
There are many other interesting features in the toolbar that provide capabilities to help diagnose issues:
- Always refresh from server – This allows you to ensure you are testing against the latest version of a resource from the server instead of a potentially locally cached file that might be outdated.
- Clear cache – This ensures the browser’s cache is clear before loading the page and ensures a clean network session.
- Clear cookies –This provides you a shortcut for clearing the browser cookies, without having to open the browser’s settings.
- Clear entries on navigate – This allows you to focus only on the resources that were loaded during the last page refresh or navigation. Alternatively, if you need to compare with a previous session, just turn this feature off and the previously captured log will not be removed after a page refresh.
- Clear session – At any point, you can use the clear session button, to clear any network traffic information recorded during the session.
Summary view
The summary view in the network tool is very descriptive and we have described how you can filter its content. Each row has the following data about the captured traffic:
- Name – The name and URL path of the resource being requested.
- Protocol – The protocol used when requested this resource. For example: HTTP or HTTPS (HTTP/2 is coming).
- Method – The HTTP method used on the request (e.g. GET, POST, PUT, etc).
- Result – The response status code and text message as returned by the server. To highlight potential issues we colorize 4xx and 5xx status codes.
- Content type – The MIME type of the response as returned by the server.
- Received – The total size of the response payload as delivered by the server.
- Time – How long it took to download the resource since the request was initially sent.
- Timings – A graph that shows where network activity occurred over time. This graph or waterfall view, shows you when a resource was requested and when it finished
We also added some productivity enhancements to improve the visibility of important debugging details:
- By default, the requests are sorted in chronological order, but they can be sorted differently by clicking on a different column header.
- Requests fully served from the cache are marked as “(from cache)” in the Received column. This helps you understand if you are using the cache effectively, perhaps to save user bandwidth, or even if you are caching responses by mistake and providing the end-user of your application with outdated data.
- Errors such as 4xx or 5xx are displayed in the Results column with a red status code as well as highlighted in the summary bar, bringing your attention to these potential issues that might need resolving.
Details view
Details of a request are accessed by opening the summary view and by double clicking on a request. The details panel will open up to expose relevant details about that request and response.

The details panel is divided into the following sections:
- Headers – Provides visibility into the request and response headers as well as summarizes important aspects such as the URL, method and status code.
- Body – Displays the request and response payload bodies as well as provides options to “pretty print” JSON, XML, HTML, CSS, JavaScript and TypeScript content which makes them easier to read.
- Parameters – Breaks down the query string parameters into an easy-to-read format.
- Cookie – Displays the data of the request and response cookies.
- Timings – Displays the timing stages involved in acquiring the respective resource. Since redirects affect the time involved in downloading a resource, this tab also indicates if a resource was redirected from or was redirected to a different resource.

The new network tool is available for developer tools in IE11 and Microsoft Edge on Windows 10. If you are a Visual Studio developer, you will also benefit from the same tooling experience that is now available in Visual Studios 2015, which allows you to debug your JavaScript, managed and native Windows and Windows Universal apps.
We are currently refining the experiences and we’ll provide more updates as changes roll out in preview builds. This is a preview, so you may notice some rough edges that will be addressed in future updates. In the meantime, we encourage you to continue providing suggestions, bugs, or requesting experiences you believe can make your daily development activities easier and more effective.
Let us know your thoughts about the features announced today by leaving a comment below, reaching out on Twitter, or visiting our User Voice site to express your opinion on what we should work on next!
— Ruben Rios, Program Manager, Internet Explorer