

With the launch of the unified Dev Center last year, we released the Windows and Windows Store trends page to provide much of the information typically covered in this blog series. In an effort to provide you with the new and relevant data to make decisions for all the apps you publish, this series focuses on trends for the entire Windows ecosystem, including PCs, tablets, and mobile devices running Windows 8.x and Windows 10.
Trends of note this quarter:
- Downloads by category: First holistic view of downloads across all Windows devices and operating systems
- Categories with opportunity : Navigation & Maps and Games: Racing & Flying offer the highest incremental opportunities
- Windows Store languages: Spanish, Brazilian Portuguese, Russian, Hindi, and Italian increase in downloads last quarter
- Paid transactions by market: New information
- IAPs by Games subcategory: New information
Windows 10 adoption trends
As announced in January, over 200 million PCs, tablets, and phones across the globe are now running Windows 10, making it the fastest growing version of Windows in history. Over 3 billion visits have been made to the Store since the Windows 10 launch. While Windows 8.x still accounts for the majority of Store downloads, Windows 10 users are the fastest growing download segment, growing both in volume and total percentage of downloads
This past holiday season we saw double the number of paid transactions for PC and tablet customers over the previous holiday season, and Windows 10 customer generate 4.5x more revenue per device when compared to Windows 8. For more information, please refer to the Windows 10 Store Growth opportunity post.
Downloads by category
The October through December 2015 download information provides the first insight into the new Store category structure across a full quarter, and the first holistic view of category popularity across all Windows devices and operating systems. This alignment has shifted the order of the most popular categories, though Games is the dominant category. Utilities & Tools moving into the second spot with 15%, more than doubling its share of total downloads. Photo & Video, Music, and Social round out the top five.
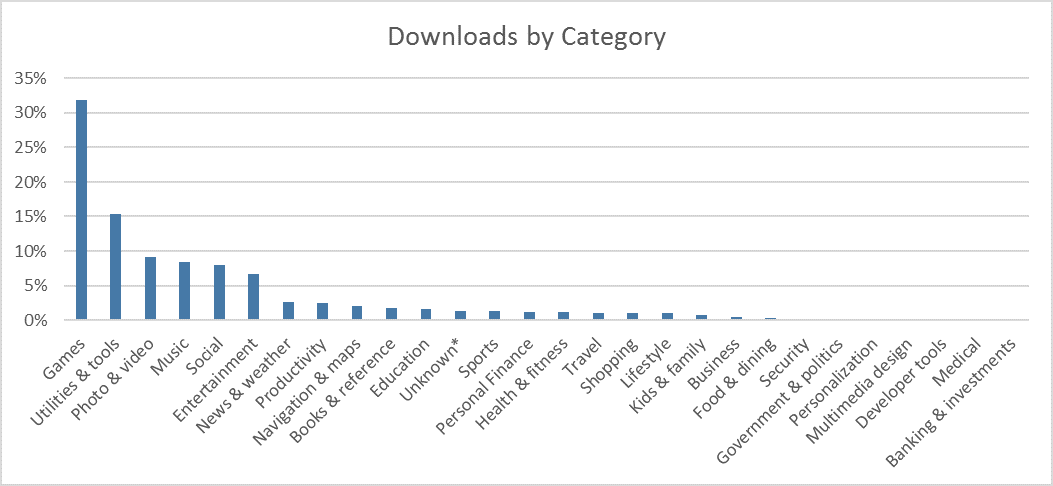
Worldwide, October-December 2015
The new category structure also provides insight into the subcategories of Games. Action & adventure continues to be the most popular Game subcategory, followed by Puzzle & trivia. Racing & Flying moves into the number three spot, while Family & kids and Strategy enter the top five this quarter.
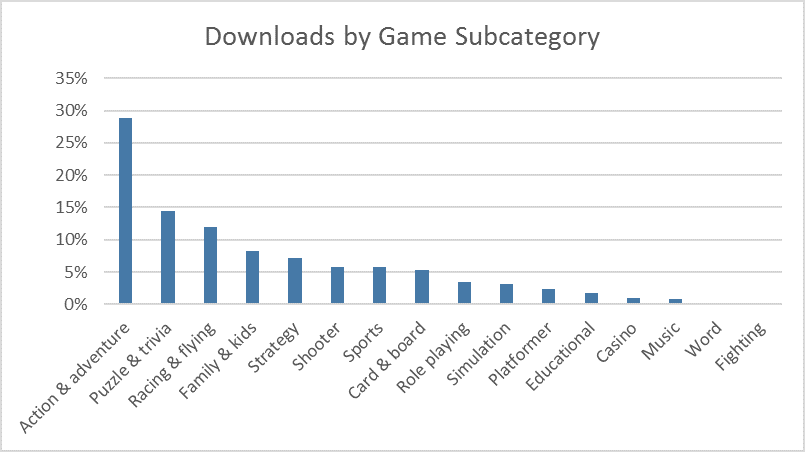
Worldwide, October-December 2015
Categories with highest incremental download opportunity
Understanding which categories have the highest ratio of downloads per app can also be helpful. This is a function of total downloads versus total available apps in that category. For example, while Games is the most-downloaded category, Navigation & Maps has more downloads per available app.
As Windows 10 adoption continues to grow, we’re seeing significant movement in the categories with the most opportunity across the reporting periods. In the last update, Productivity had more than double the opportunity of any other category, but this quarter it falls to the sixth spot. We see Navigation & Maps along with Multimedia Design enter the top five this quarter. Games, Photo & Video, Social, Productivity, and Utilities and tools are all in the top six categories for downloads and total opportunity. If your goal is to reach the maximum number of downloads possible, analyze these categories to understand which one presents the highest potential for your apps.
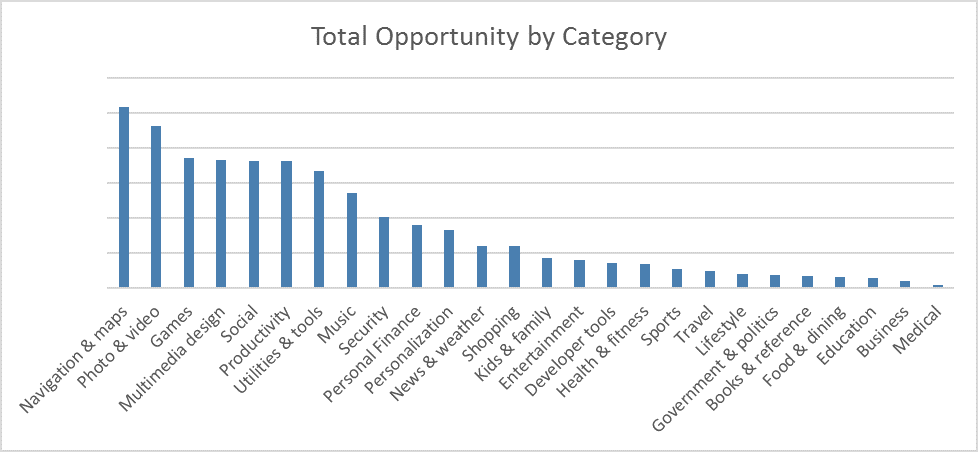
Worldwide, October-December 2015
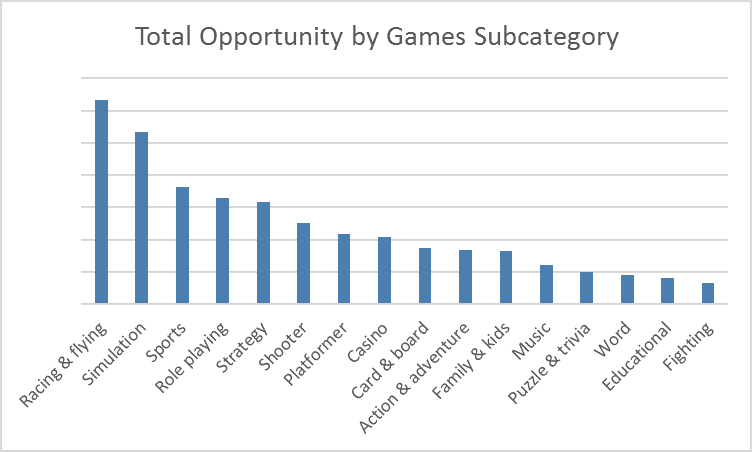
The Games subcategory data also allows us to take a look at which subcategories have the most opportunity. Racing & Flying takes over the number one spot this quarter as this subcategory continues to gain in popularity with Store customers. Simulation moves to the number two spot, while Sports and Role playing enter the top five for the first time. As previously noted, the Word and Fighting subcategories are under-represented, which limits the number of downloads and represents a good opportunity for developers.
Paid transactions by market
In past Store trends posts we’ve provided the total downloads by market. While downloads are increasing across all markets this reporting period, the top markets remain static. And with the addition of the new IARC age rating system this period, it has never been easier to offer your app in every Store market. Today we’ll provide new information that you might find more insightful: which markets are generating the most paid transactions.
This graph reflects the total number of paid transactions generated by each market, including both paid apps and in-app purchases. The United States accounts for 36% of all paid transactions, though the United Kingdom, Germany, and France account for an additional 25%. This information is useful if you plan to monetize through paid apps or in-app purchases.

Worldwide, October-December 2015
Windows Store customer languages
Language is a key driver of downloads and adoption, and should be taken into consideration along with markets. We see some realigning of the top languages this quarter with the release of Windows 10 for mobile. For example, Russian rises to the number four spot, while Mandarin drops to ninth. English remains in the top spot, but the percentage of overall Store customers downloading apps in languages other than English has increased: Spanish, Brazilian Portuguese, Russian, Hindi, and Italian have seen an increase in total downloads over the past quarter.
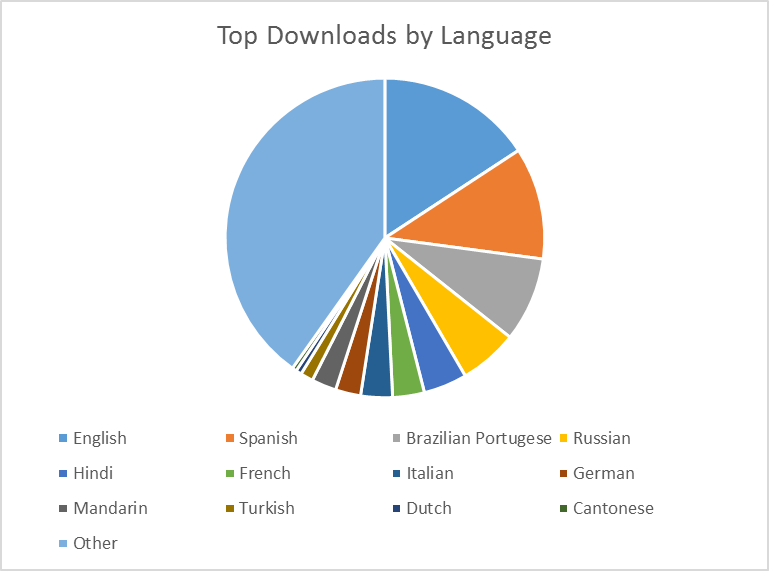
Worldwide, October-December 2015
Monetization options
Another important decision is which monetization option to adopt: paid apps, in-app purchase, and/or in-app advertising (showing ads in the app). Paid apps, though clearly the lowest source of revenue, remain stable as 14% of overall revenue and this model continues to be an important revenue source for specialized apps. It’s important to note that the advertising revenue appears to be second to in-app purchases, but this percentage only includes revenue paid out by Microsoft Advertising; revenue generated through other ad networks is not included in this total. In-app purchases continue to be the most significant source of overall revenue, accounting for roughly half of total revenue generated.
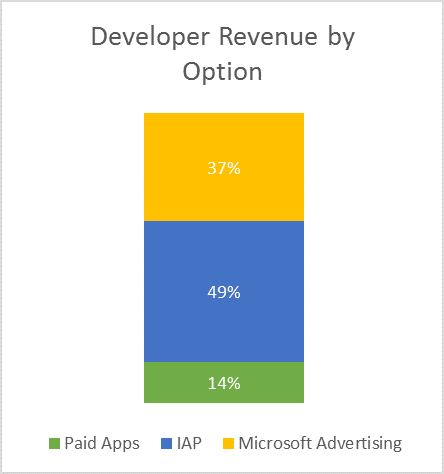
Worldwide, October-December 2015
In-app purchases by Games subcategory
In-app products (IAPs) remain the most significant source of revenue, and are particularly popular in “freemium” apps that are free for customers to download and offer various consumable and durable products for an enhanced experience. The IAP model is particularly popular in the Games category, which comprises over 85% of IAP purchases from October to December 2015.
For the first time, we’re looking into which Game subcategories generate the most in-app purchases from their customers. Total downloads and incremental opportunity by subcategory are important to consider if your primary goal is to reach the highest number of downloads possible, but if you plan to monetize your game using IAPs, this breakdown offers an additional level of detail for analysis.
While Action & Adventure accounts for more than 20% of all downloads in the Games category, yet it only accounts for 15% of all IAPs. Puzzle & Trivia, which ranks third in the Games category with just over 10% of total downloads, ranks second and accounts for 38% of all IAPs. Music, which ranks second with over 20% of all downloads, accounts for only 2% of IAPs while Strategy, which ranks eighth in total downloads, ranks third with 13% of all IAPs.
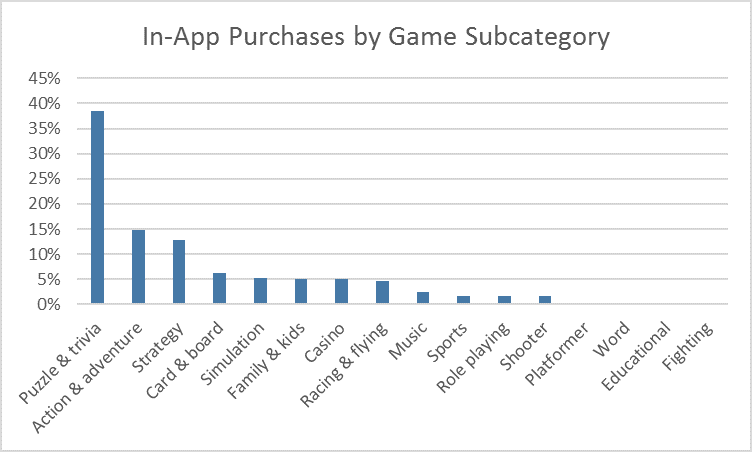
Worldwide, October-December 2015
For further analysis
We recommend taking time to browse through the app catalog in the categories you’d like to develop in. We’d suggest analyzing the top apps in each category to see what makes these apps successful based on the trends data provided.
As customers continue to look for apps that will work across all their devices, Universal Windows Platform (UWP) apps are growing in popularity. Windows 8.1 code is designed to easily transfer into a UWP app, and doing so will allow you to take advantage of the entire Windows customer base. If you haven’t already, we encourage you to begin developing apps on the UWP platform.
We hope this data helps inform your decisions on investment areas for new apps and app updates. We continue to look for new data to you that can help you make investment. Please share your ideas and let us know data and insights you’d like to see in upcoming installments.