

The latest Windows 10 Insider Preview updates bring great new improvements to the F12 developer tools, including some of your most requested features from UserVoice and a new experiments initiative that allows you to try out powerful new features before they’re finished.
We are also happy to announce that our F12 developer tools documentation is now part of the Microsoft Edge Dev site and fully available on GitHub. From this point on, the docs will not only be influenced by your feedback, but you’re invited to contribute and help shape our documentation going forward.
Debugger improvements
Improved CSS editing workflow
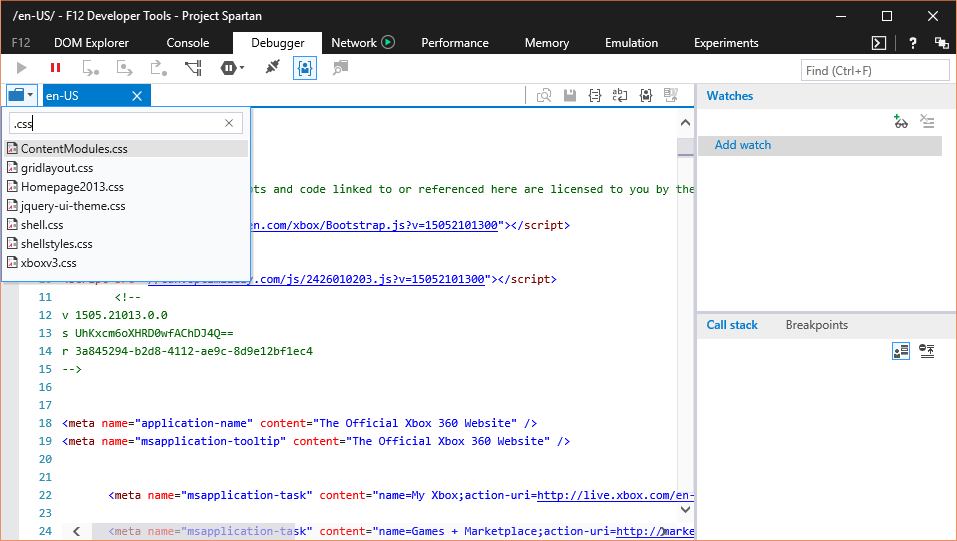
As a way to improve the usability and ease of styling your web pages, CSS files are exposed via the Debugger’s file picker, allowing you to search and select any of the CSS files referenced on the HTML markup.
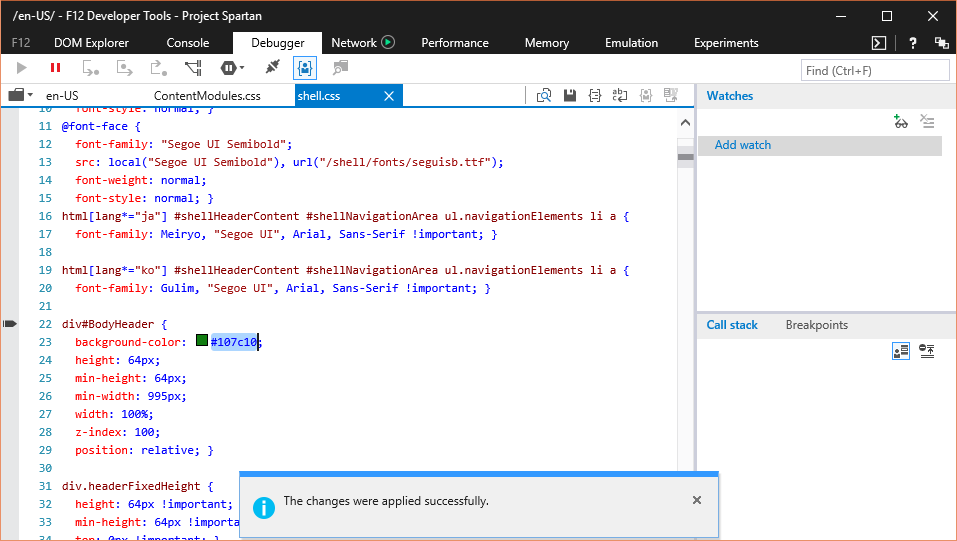
Selecting a file allows you to edit it directly on the Debugger’s text editor. New style changes can be applied via the save button or the Ctrl+S keyboard shortcut.
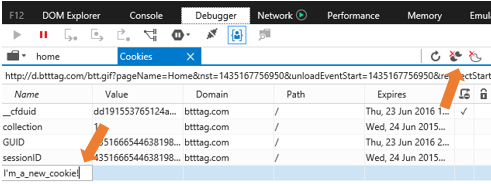
Cookies
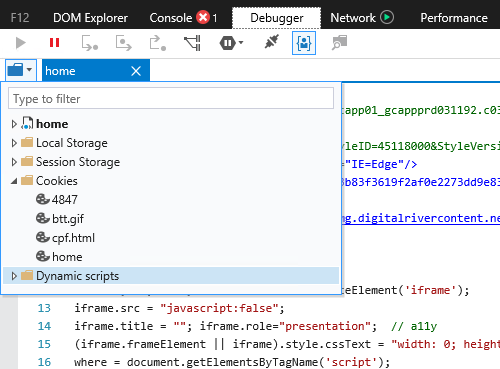
The Debugger now also provides detailed information about cookies that have been created by an HTTP header or via JavaScript. The cookies folder inside the Debugger’s file picker displays a list of the frames loaded by the page. Selecting one of these frames opens up table view of its cookies.
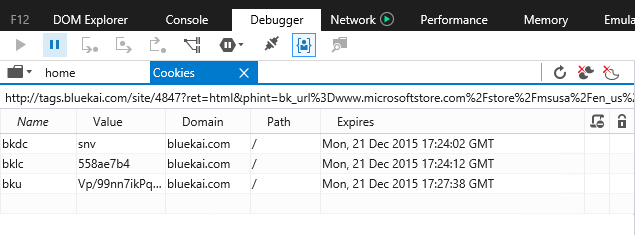
The cookies view allows you see and modify existing cookies as well as create new ones. You can also clear individual cookies, session cookies or all cookies using the toolbar or the table’s context menu.
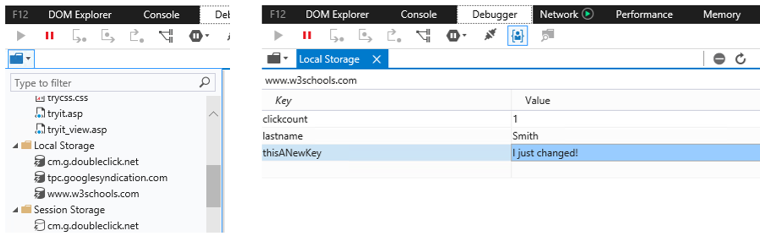
Web storage
Session and local storage are exposed on the debugger’s file picker. Selecting them opens their contents on a new tab that allows you to both inspect and edit their contents.
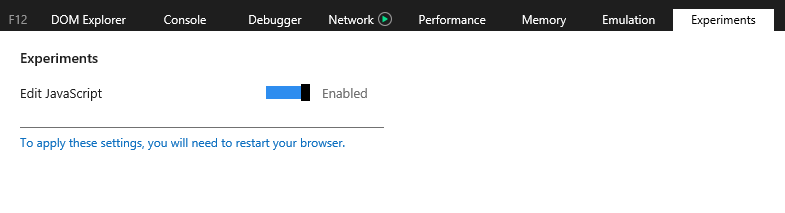
Experiments
The F12 developer tools now have a new experiments tab, which lets you test drive powerful new features that are not fully ready for prime time. These features are disabled by default – you can enable them with the toggles under the Experiments tab.
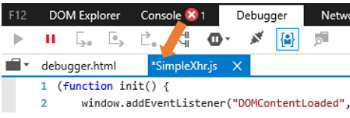
Our first experiment in the latest build allows you to edit any JavaScript file in the debugger source viewer. Enable the “Edit JavaScript” toggle and restart your browser.
Once the feature is enabled, simply click on the Debugger’s source viewer to place the cursor and start modifying your JavaScript!
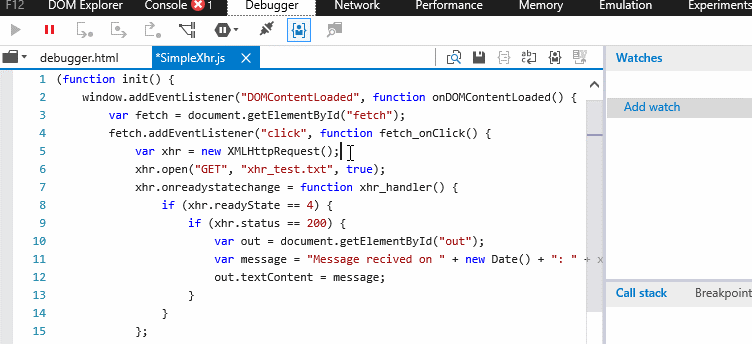
As you make edits, a dirty flag denoted by an asterisk (*), will show up in the document’s tab. This implies the document has changed but has not yet been saved.
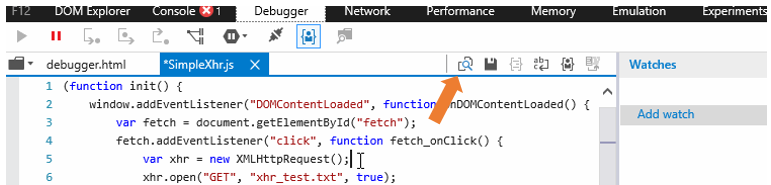
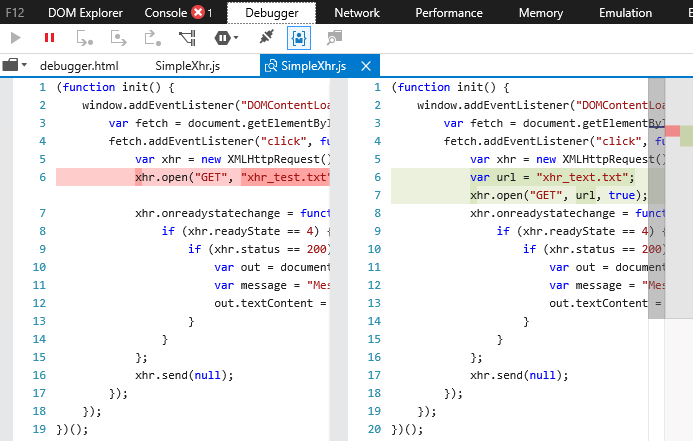
Your edits can then be applied to the page by pressing the save button or using the Ctrl+S keyboard shortcut. Once saved you will be able to compare the modified document to the original document using the diff command.
Doing so will open up a diff view of the document.
All changes to the document will be lost when you navigate away or refresh from the current page. You will not be able to edit when paused in the debugger or when a document has been pretty printed.
Help us shape our docs!
Over the coming months we will be working on adding new sections and content to enhance the documentation experience. If you’d like to see new coverage or have feedback, please reach out and let us know how we can improve our docs.
For those of you who would like to be more actively involved, we encourage you to visit our GitHub repository and contribute to our documentation by either creating new GitHub issues, editing the existing documentation or even proposing new content. We’ll take a look at your suggestion and will work together to incorporate them to the docs. If you are interested, please visit the repository’s readme to better understand how to contribute.
Remember we value your feedback and we want to encourage you to continue providing feature suggestions, bugs, or requesting experiences you believe can make your daily development activities easier and more impactful. Let us know your thoughts about the features announced today by leaving a comment below, reaching out on Twitter, or visiting our User Voice site to voice your opinion on what set of features we should work on next!
— Ruben Rios, Program Manager, Microsoft Edge