Debug Microsoft Edge from Sublime or VS Code with the new Edge Diagnostics Adapter

Microsoft was a pioneer of in-browser tooling in 2005 with the IE Web Developer Toolbar, and we’re continuing to make investments in the developer tools in Microsoft Edge to make daily development and debugging tasks easier and more effective. Over the past decade, building for the web has fundamentally changed, from relatively simple documents to real-time applications on a number of different devices. This has in turn changed the toolset many of us rely on – it’s common for web developers to use a combination of editors/IDEs, command line tools, and in-browser developer tools over the course of a typical project.
The Edge Diagnostics Adapter exposes a Chrome Debugging Protocol endpoint, which is injected into the running instance of Microsoft Edge. You can start the Adapter and connect your tools to Edge right away, no restart or command line flag required. This makes debugging in Edge with your existing editor or other tools a smooth experience, as tools can connect right they’re needed, without interfering with application state.
Visual Studio Code debugging for Microsoft Edge
Alongside the Edge Diagnostics Adapter, we’re excited to introduce an integrated debugging experience for Microsoft Edge in Visual Studio Code. This provides the same powerful experience we previously introduced in our Chrome Debugging for VSCode release.
You can read more about our Edge Debugger for VSCode in the Visual Studio Code Marketplace.
Sublime Text debugging for Microsoft Edge
We’ve also partnered with Sublime Web Inspector to kick start the community of third-party tools that work with Edge. Together with the Edge Diagnostics Adapter, you can now use Sublime Web Inspector to perform JavaScript debugging in Edge directly from Sublime.
If you are a Sublime user, you can check out the Sublime Web Inspector extension and let us know what you think!
Enabling existing tools to work with Microsoft Edge
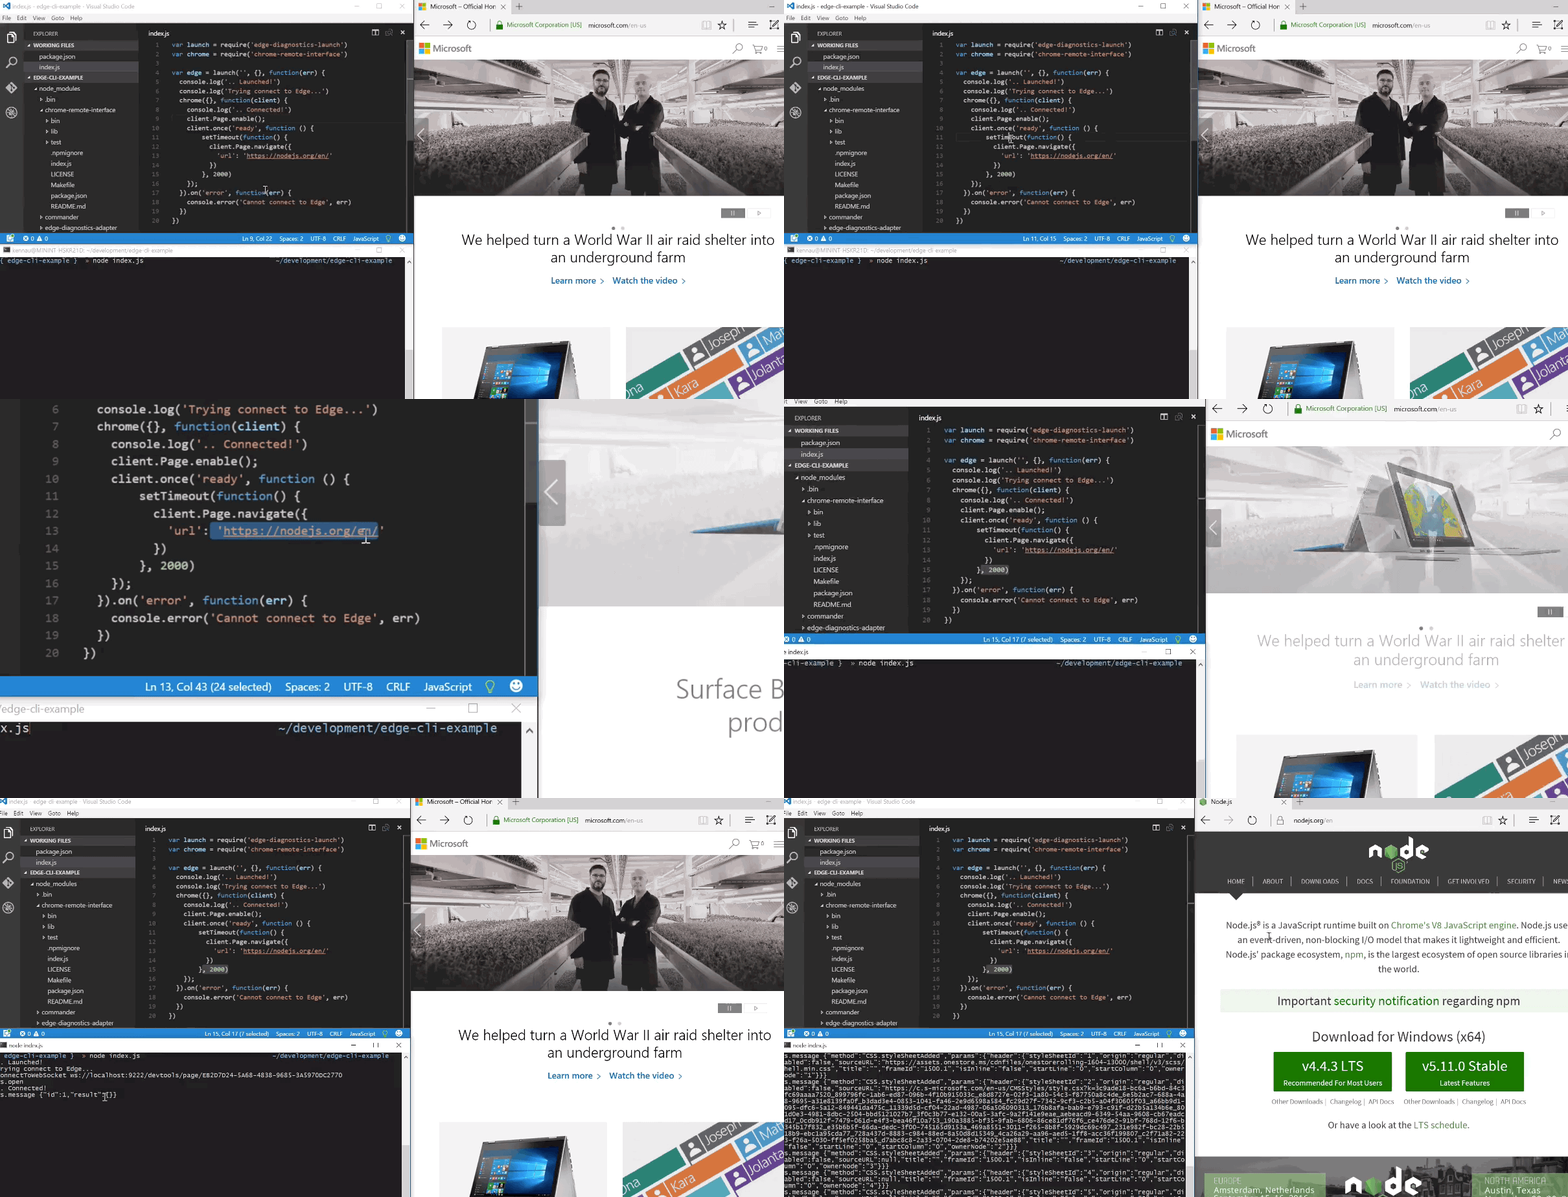
Lastly, we also have been working with the existing Chrome Debugging protocol community, and we are happy to see Microsoft Edge support being incorporated into open source projects like AmokJS/CodaJS, chrome-remote-interface and chrome-debug-protocol, that for example allows you to remote debug Edge with just a few lines of JavaScript in node.js.

We love small CLI-based tools like the above, and we’re excited to see what the open source community can build in top of Microsoft Edge.
What’s next
Back in April 2015 we released our IE Diagnostics Adapter as our first experiment to enable third-party tools to work our browsers, and with the release of our Edge Diagnostics Adapter, we are also marking the deprecation our IE Diagnostics Adapter, as our continuous focus is solely on Microsoft Edge.
We’re interested in moving towards a standardized interface that enables tooling from multiple vendors to work together. Our adapter for the Chrome Debugging Protocol is a start, but there’s still work to be done in order to ensure compatibility between tools and browsers. This is why we are releasing our Edge Diagnostics Adapter as a standalone MIT licensed open source project on GitHub, so we can work together with the community.
This is a work in progress – you can find known bugs on our issues page, and listed supported APIs in the README. We are here to build even better debugging experience for Microsoft Edge, so If you have any issues or ideas for improvements, feel free to reach out to us on Twitter or GitHub.
Our goal is to make it simpler to build for the web. There’s lots to be done and we think the best approach is fostering an ecosystem where tooling, regardless of the vendor, able to work together and across browsers. We are excited to see what kind of tools we can build together.
We think anyone should be able to build tools – just like anyone can build for the web.
– Andy Sterland, Senior Program Manager, JavaScript Diagnostics
– Kenneth Auchenberg, Program Manager, JavaScript Diagnostics
