

Editor’s note: This continues the series we began last week, highlighting what’s new and improved in the Microsoft Edge DevTools with EdgeHTML 16.
As the web platform evolves, the line between web and application developers continues to blur. It’s common now for a web site to be more like a web app, with complex, single-page user interfaces built up by a combination of libraries and custom JavaScript code. This in turn has led to a web platform that requires more sophisticated tools to efficiently debug.
As we rely more and more on JavaScript to build up the DOM, and rely on tools that interact with and abstract away from us the nuances of DOMs across browsers, we lose the ability to easily know what caused a change to an interface node, especially if that change is unexpected. In EdgeHTML 16 (available with the Windows 10 Fall Creators Update), we’ve introduced the ability to break on mutations caused by any of the 450+ DOM APIs in the EdgeHTML platform and jump directly to the script that triggered the change.
For those who use Chrome DevTools, this will be a familiar and welcome addition to Edge debugging. It was our goal to implement and advance on a similar experience to make jumping between the two tools as seamless as possible. Read on for the changes you can expect in the Fall Creators Update (and can preview now via Windows Insider builds).
Breakpoint types
There are three breakpoint types:
- Subtree modifications: when a node is added or removed from the subtree of the element on which the breakpoint is set
- Node removal: when the node the breakpoint is set on is removed from the DOM tree
- Attribute modifications: when an attribute of the node on which the breakpoint is set is modified
Setting and managing breakpoints
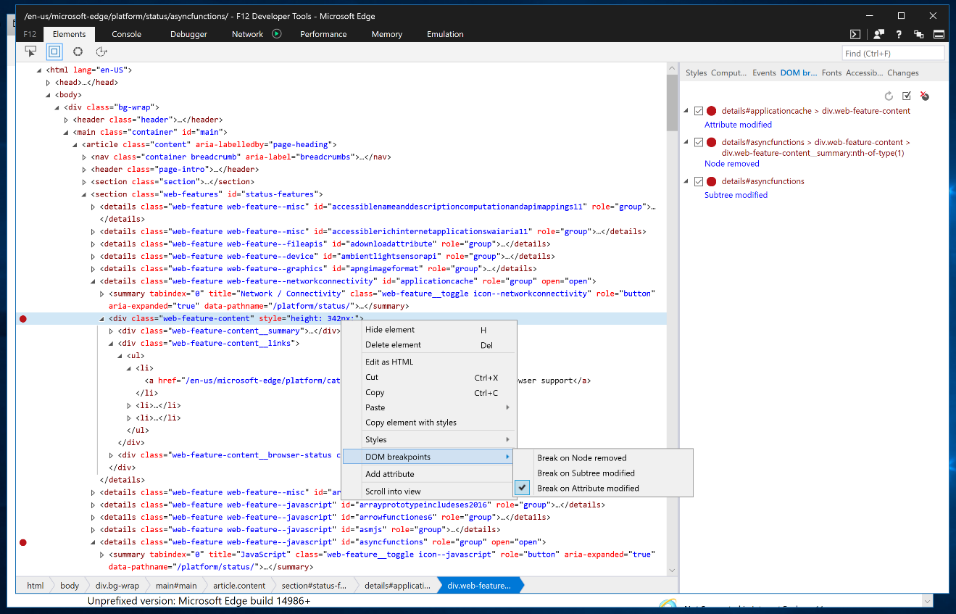
To set a breakpoint, right-click on a node in the DOM tree in the Elements tool. Under the DOM breakpoints item, you’ll see options to set and unset the supported breakpoint types.
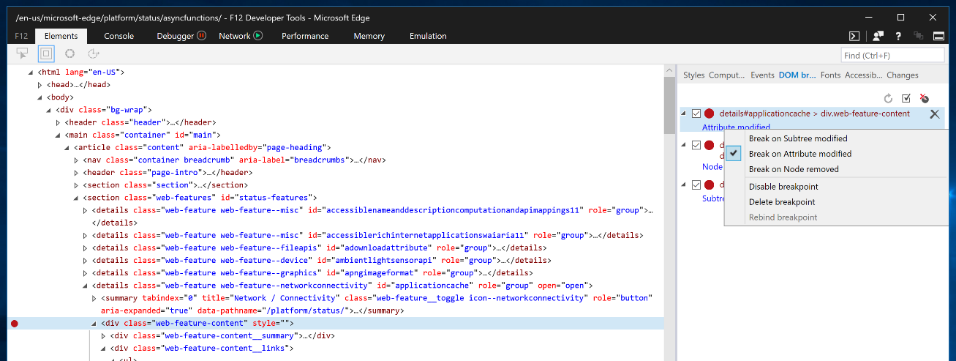
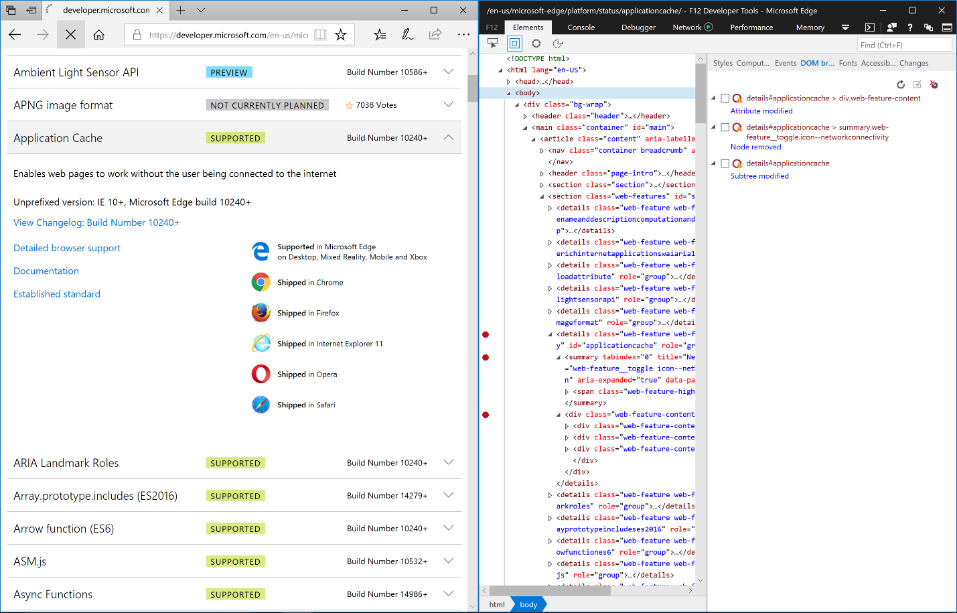
When you add a breakpoint, a red breakpoint indicator appears next to the node in the DOM tree. The breakpoint is also listed in the DOM breakpoints pane which exists in both the Elements and Debugger tools. You can disable and delete breakpoints by using the mouse to click the checkbox and delete icons, respectively. You can also right-click, or use the keyboard, on a breakpoint to invoke a context menu to apply the same actions:
Triggering a breakpoint
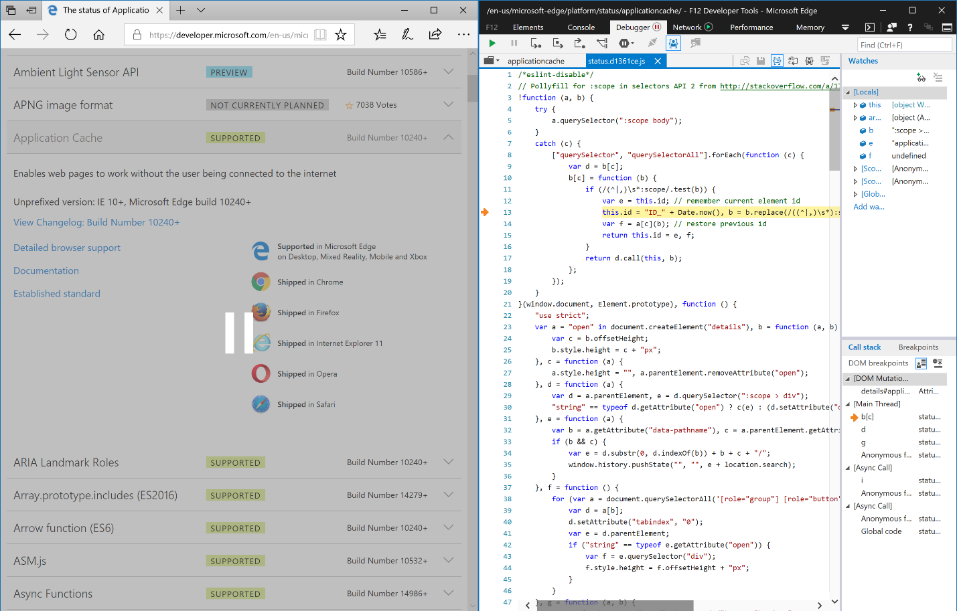
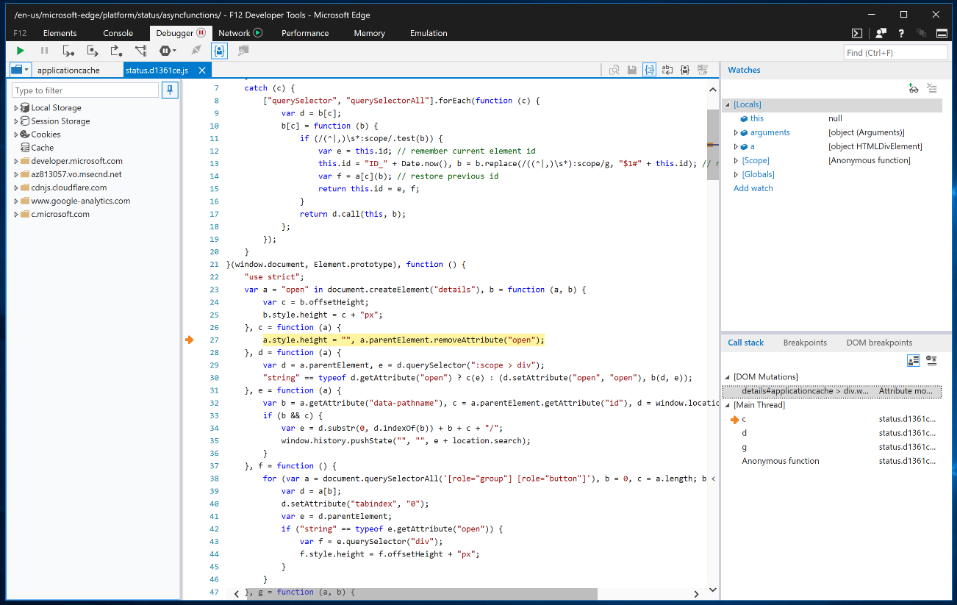
A breakpoint is triggered whenever one of over 450+ DOM APIs are called by JavaScript. When the breakpoint triggers, you’ll jump to the Debugger tool with the file containing the triggering script opened and the line with the API call highlighted.
In the Debugger tab, you’ll notice at the top of the call stack is an entry with the selector for the node the breakpoint was triggered on, and the type of breakpoint triggered.
Breakpoint persistence
We store breakpoints as part of your Edge DevTools settings and scope them to the URL of the page they’re set within. When you close and re-open Edge DevTools, or refresh the page, we’ll restore and attempt to automatically rebind the breakpoints to their respective DOM nodes. If we’re unable to automatically rebind them, we’ll indicate that they’re unbound in the UI with a warning icon on the breakpoint circle.
You can use the context menus or shortcut icons in the DOM breakpoints panes to manually rebind any breakpoints we were unable to automatically rebind.
What’s next for DOM Breakpoints
We’re excited to launch this feature and hope to solve for as many developer scenarios as we can, but want to highlight a few gaps in the current implementation:
- We don’t currently support rebinding breakpoints inside iframes. If you set a breakpoint in an iframe and close Edge DevTools or refresh the page, the breakpoint will be lost.
- If your script encounters a synchronously-executed breakpoint before the DOM readyState is completed, you won’t be able to set a DOM breakpoint while the debugger is paused. You can typically remedy this situation by setting the defer or async script attributes.
- For synchronous scripts, we trigger automatic rebinding of breakpoints when the window.onload event is called. In this case, we may miss binding breakpoints that would trigger during initial script-driven build-up of the DOM. For asynchronous scripts, we trigger a rebind attempt before the first script executes, so your breakpoints may rebind and trigger as desired.
We’re evaluating closing these gaps in future releases, as we continue to evaluate the prevalence of these scenarios. If you have feedback and find these unsupported areas to be blockers, please let us know!
Tell us what you think
We hope you enjoy this new addition and find it improves your productivity as you go about your developer workflows. If you find any bugs, please report them via the Feedback Hub. If you have questions or feature requests, don’t hesitate to leave a comment here, or reach out to us on UserVoice or Twitter.
— Brendyn Alexander, Senior Program Manager, Microsoft Edge DevTools