

Improvements to the DevTools Console in the Windows 10 Fall Creators Update
We made significant improvements to the Microsoft Edge DevTools in EdgeHTML 16 with the Windows 10 Fall Creator’s Update, including new support for DOM mutation breakpoints and event and CSS inspection in the new Elements tab.
Today, we’d like to walk through new improvements we’ve made to the Console to improve the output and input experiences of working with the Console. Our main goals were to increase the flexibility of the Console in displaying information, and to increase your productivity when working with the Console prompt.
First, let’s cover the new features we made to improve the user experience of Console output.
Log message consolidation and UX improvements
Have you ever written a console.log statement in a for loop and watched your entire Console fill up with output? Or have you found it difficult to easily spot the differences between warnings, info, and errors without having to resort to using filters?
To help address issues like these, we’ve updated the Console output to better differentiate between console message types. In addition, the Console will now consolidate repeated messages.
Sample code:
| function generateMessages() { | |
| for (let i = 0; i < 100; i++) { | |
| console.error("Console Errors"); | |
| } | |
| for (let i = 0; i < 100; i++) { | |
| console.warn("Console Warnings"); | |
| } | |
| for (let i = 0; i < 100; i++) { | |
| console.info("Console Info"); | |
| } | |
| for (let i = 0; i < 100; i++) { | |
| console.log("Console Logs"); | |
| } | |
| } |
Console output:
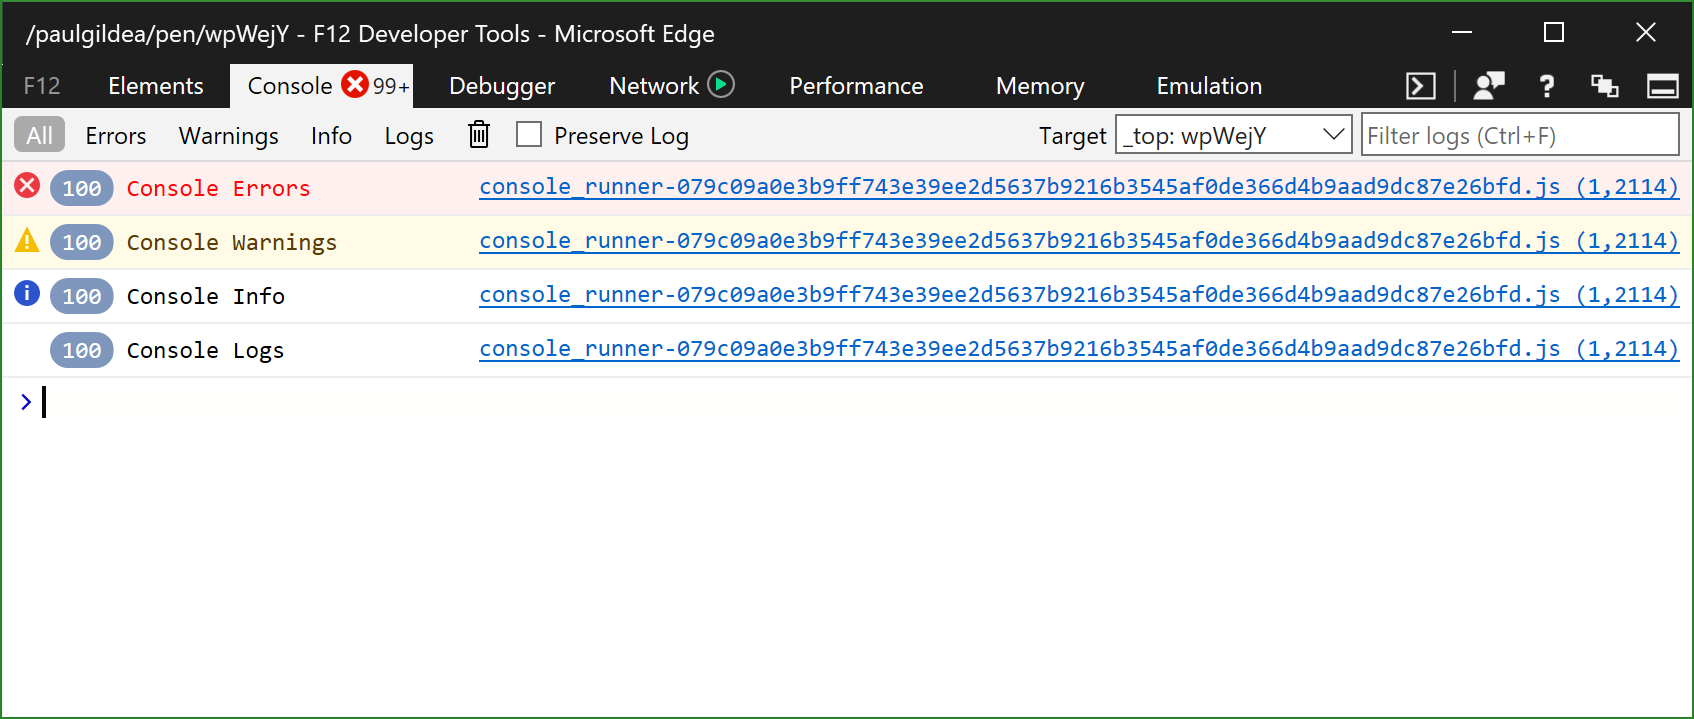
This can dramatically reduce clutter, while making it simpler to scan and easily differentiate different types of output.
Displaying tabular data with console.table
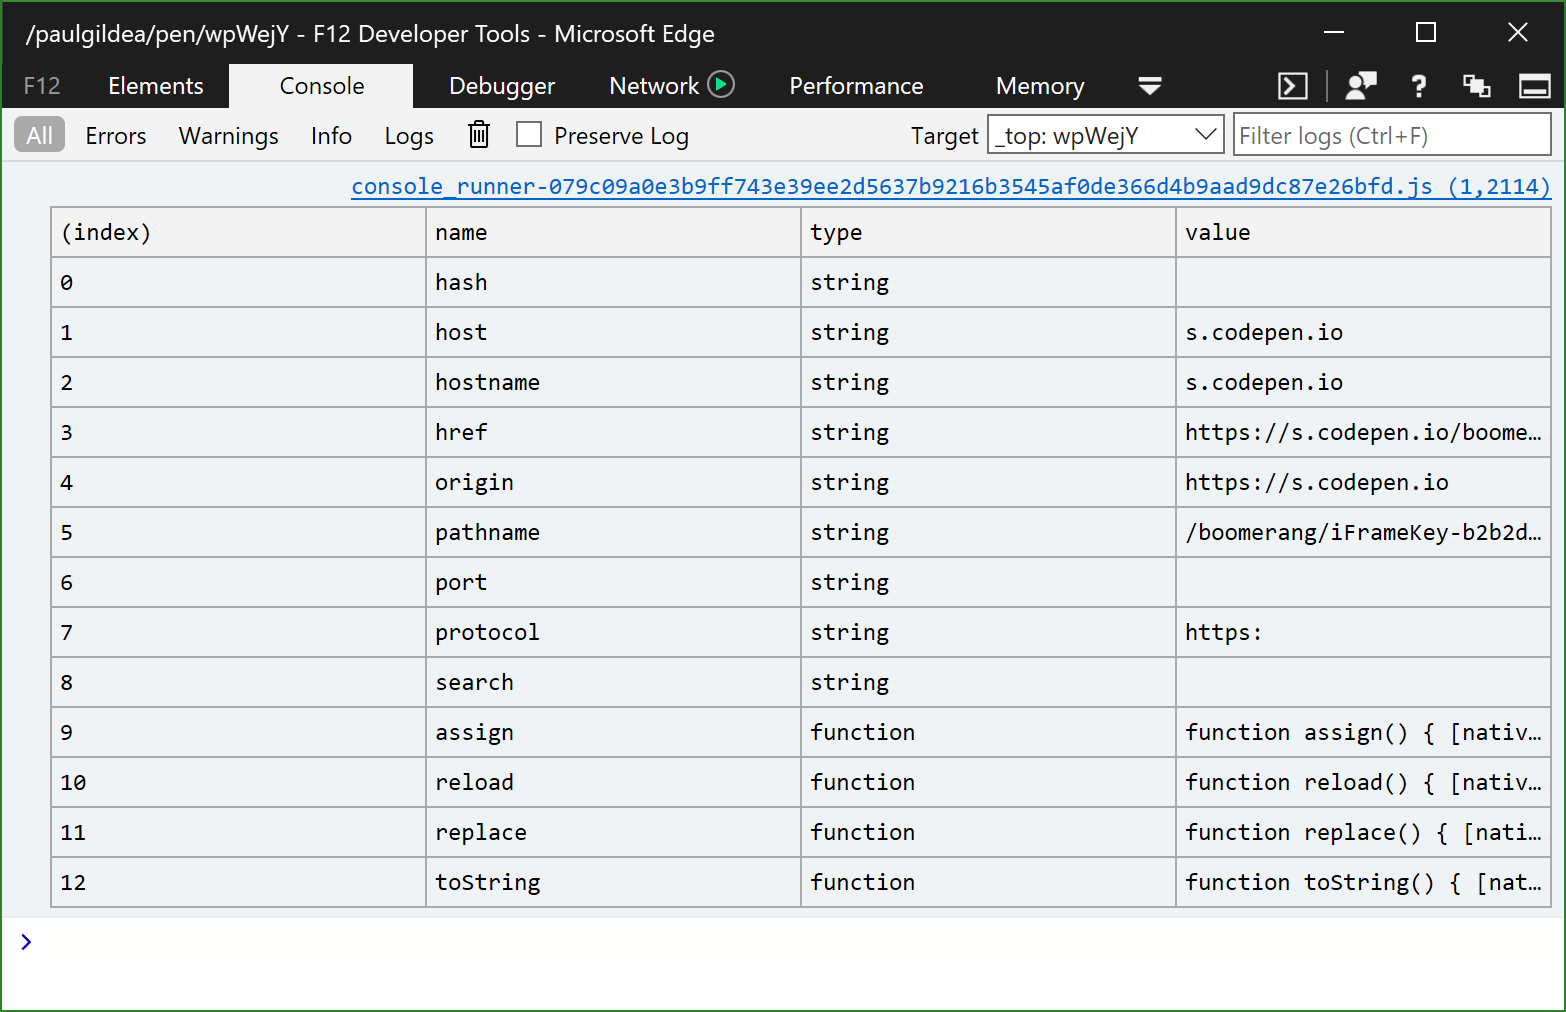
A table is a great visualization tool to help display arrays and tabular data. The DevTools Console now supports console.table, allowing you to output your data in rows and columns.
Sample code:
| let data = Object.keys(document.location).map(prop => { | |
| return { | |
| name: prop, | |
| type: typeof document.location[prop], | |
| value: document.location[prop] | |
| }; | |
| }); | |
| console.table(data); |
Console output:
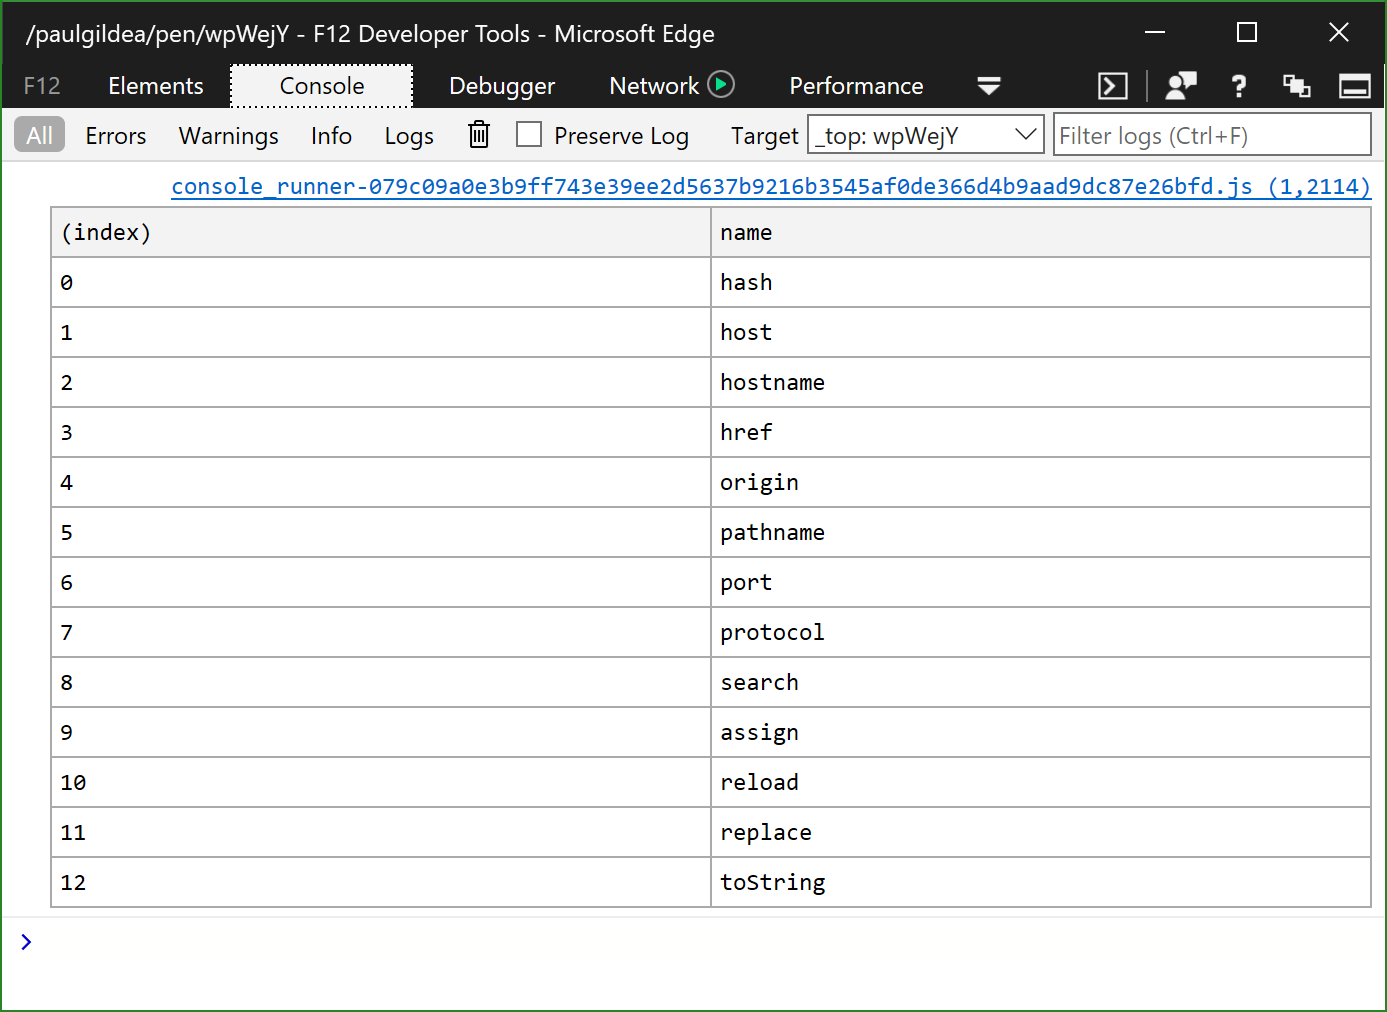
Additionally, the Console supports configurating which columns you wish to display. This gives you the flexibility to hone in on the right set of information for your project.
Sample code:
[code language=”javascript”]console.table(data, [“name”]);[/code]
Console output:
CSS formatting for Console messages
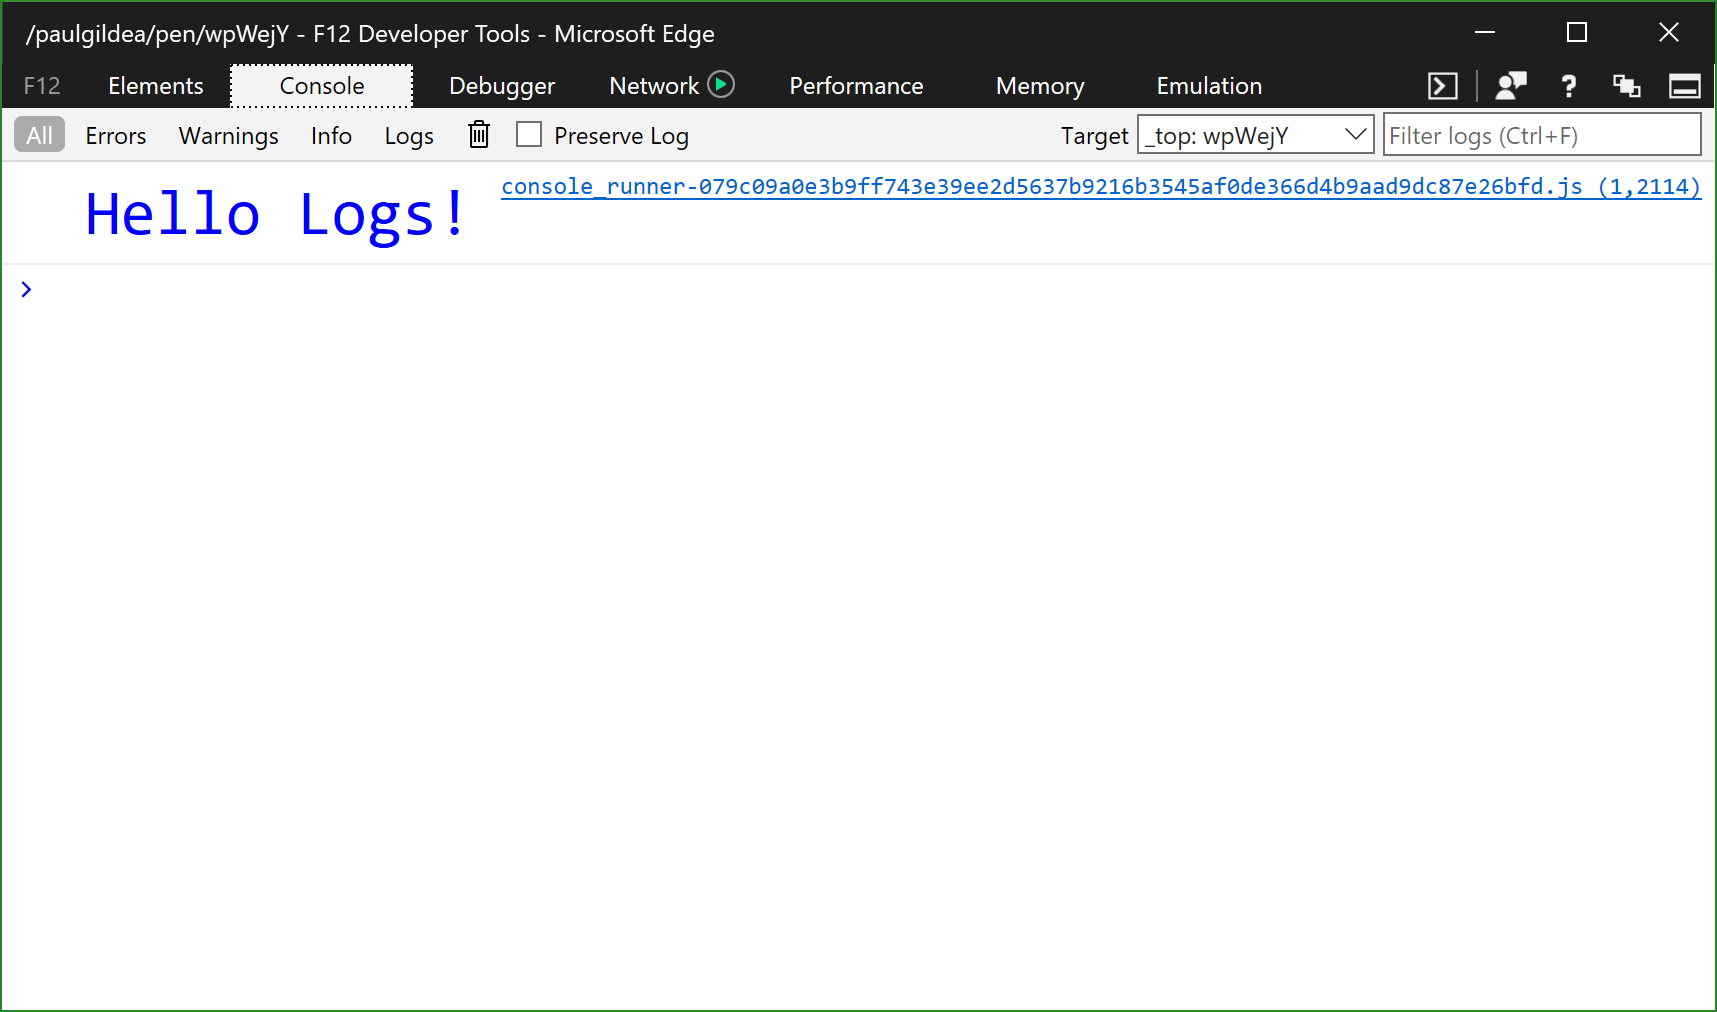
If you want to take complete control of the display of log messages, you can now do so with CSS formatting directly inside the Console. Simply add CSS styling rules to your console.log call, and you can customize the output to make your messages really stand out.
Sample code:
[code language=”javascript”]console.log(“%cHello Logs!”, “font-size: xx-large; color: azure”);[/code]
Console output:
These changes make it easier to parse and organize Console output. We’ve also made a few improvements to working with input in the Console.
Multi-line support, Improved IntelliSense, and Console API support
First, we’ve added a small-but-helpful feature in support for multi-line input. Simply use SHIFT+ENTER to create a new line without executing the command beforehand.
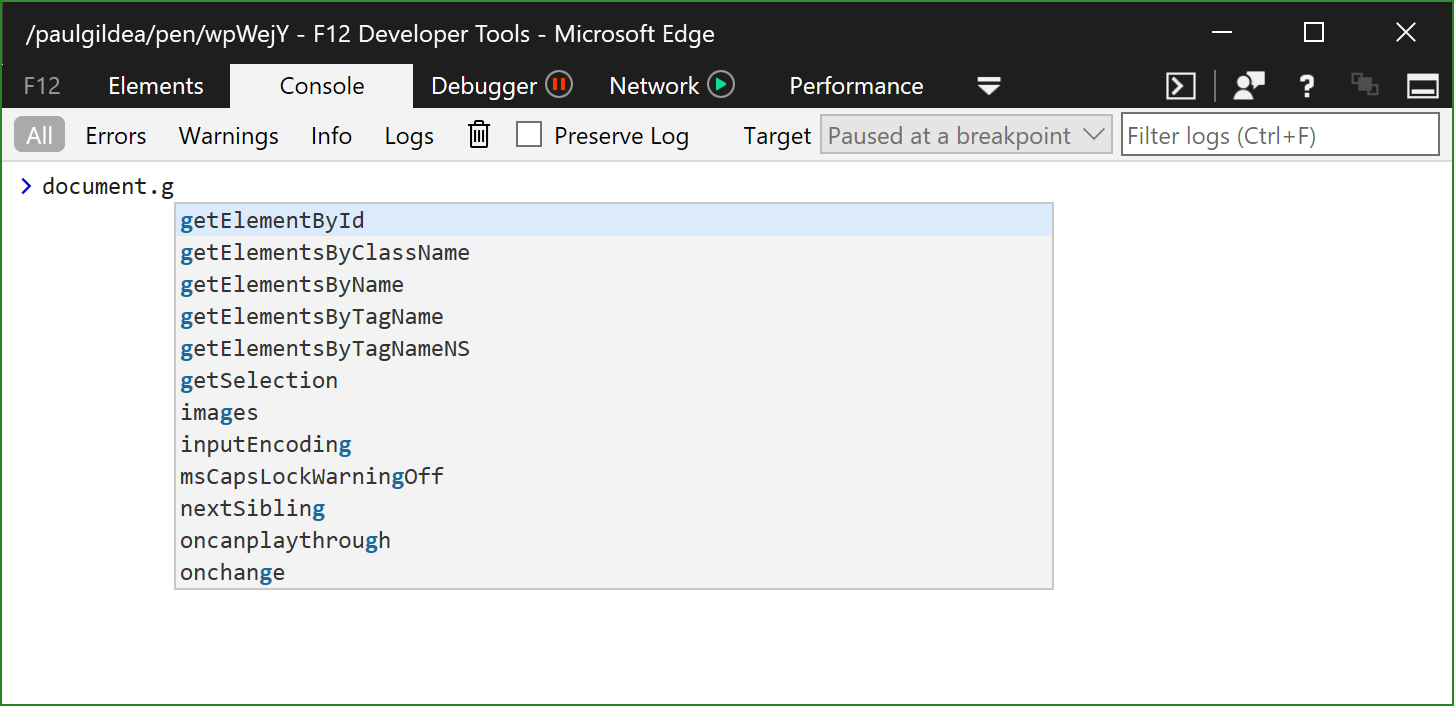
Additionally, we’ve added a faster, richer IntelliSense experience supported by the Monaco Editor, so you can be more productive in the Console. Just start typing, and you’ll see all the helpful auto-completions you’ve come to expect using other developer tools with IntelliSense today:
Finally, we’ve added several new Console APIs to round out the developer tools experience, including:
- getEventListeners(object) command
- keys(object) command
- values(object) command
- $x(xpath expression) selector

Check out the Microsoft Edge DevTools guide for exhaustive documentation on all the available and supported Console APIs and Console Commands.
We’re fully invested in making the DevTools even better so you can have the most productive development experience in Microsoft Edge. Your feedback helps us prioritize what to build next, so please get in touch if you have any thoughts or issues! We welcome your suggestions on UserVoice. If you have issues or feedback, please use the Feedback Hub app in Windows to file a bug. Finally, if you have any questions, reach out to us on Twitter @EdgeDevTools!
– Paul Gildea, Program Manager, Microsoft Edge DevTools