

Introducing the Microsoft Edge DevTools Protocol
These challenges are an opportunity for builders and consumers of devtools, requiring our solutions to enable innovation and scale. We need to provide web developers and tool vendors targeting Microsoft Edge, including other Microsoft teams, flexibility in solving these tough problems.
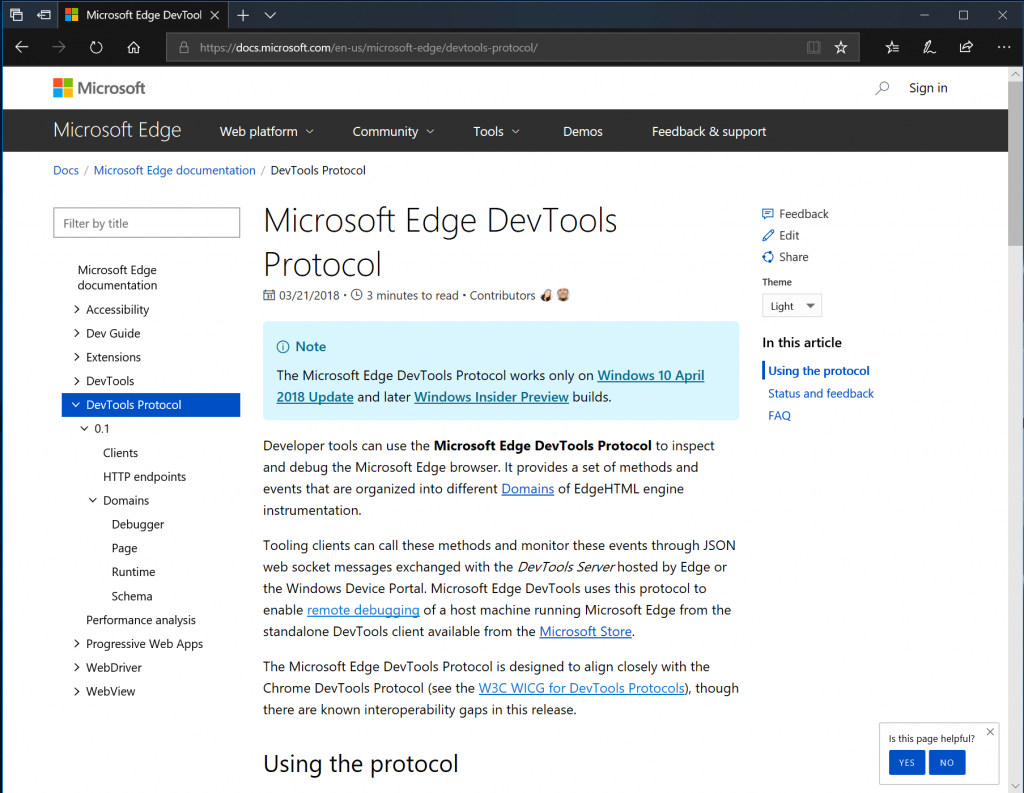
With the Windows 10 April 2018 Update, we’re taking the first major step on our journey by introducing the Microsoft Edge DevTools Protocol, a set of REST and JSON-RPC/WebSocket APIs, which enable clients to diagnose and debug Microsoft Edge tabs. In addition, we’ve worked with our teammates from Visual Studio, Visual Studio Code, and the Microsoft Edge DevTools to integrate with, and validate the interoperability of, these new capabilities within those apps.
In this post, we’ll elaborate on why we’ve taken this approach and the exciting progress we’ve made so far. We’ll provide resources throughout to help you get started using these new technologies. At the end, we’ll look at our next steps and share the many ways you can provide feedback to help us shape the future of the Microsoft Edge DevTools Protocol.
Rebooting the Microsoft Edge DevTools platform
A year ago, we set out to re-architect the Microsoft Edge DevTools platform with two general customer scenarios in mind: growing the number of devtools that work with Microsoft Edge, and expanding support for debugging Microsoft Edge on new device form factors.
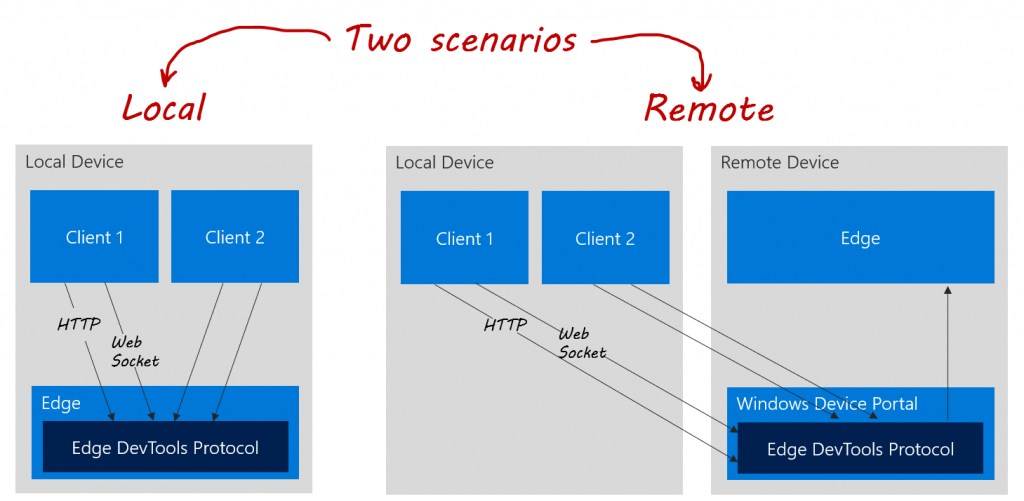
To tackle the realities described above and achieve both local and remote support, we came up with a short but impactful list of guiding principles:
- Decouple the platform and client components and release the client separately to allow for faster UX improvements and innovations
- Build the platform interfaces on standard technologies to foster a larger ecosystem of devtools with support for Microsoft Edge
- Build the platform in a way which allows devtools running locally to target instances of Microsoft Edge on remote Windows devices
- Align with other browser vendors to support ecosystem portability and efficiency
This work will span multiple releases, but we’ve already made some exciting progress. Let’s dive in.
Decoupling the Microsoft Edge DevTools platform and client
To enable us to deliver customer value more rapidly, we first looked to take the Microsoft Edge DevTools app and ship it separately from the Windows OS as a Store application.
But to ship via the Microsoft Store, we needed to build only on APIs which are publicly available to others. This lead to the creation of the new Edge DevTools Protocol (EDP). The protocol is comprised of two sets of APIs: REST and JSON-RPC via WebSocket. Through EDP, devtools can build experiences around invoking methods and subscribing to diagnostics and debugger events.
The REST APIs are primarily used to discover information about EDP such as the version, available targets, and the supported API surface. All response values are formatted as JSON objects.
| [{ | |
| "id":"00000206-87EE-4D55-0091-C4C08A1F30C8", | |
| "title":"Bing", | |
| "type":"Page", | |
| "url":"https://www.bing.com/", | |
| "webSocketDebuggerUrl":"ws://localhost:9222/target/00000206-87EE-4D55-0091-C4C08A1F30C8" | |
| }, ...] |
The WebSocket APIs are used to issue debugger and diagnostics commands and subscribe to correlated events. The APIs are broken down into Domains, which further break down into Methods, Events, and Types. A simple example would be the Debugger.setBreakpointByUrl API. A client would issue a JSON-RPC command looking something like this to set a breakpoint based on a JS file URL and location:
| { | |
| "id":209, | |
| "method":"Debugger.setBreakpointByURL", | |
| "params": { | |
| "lineNumber": 15, | |
| "url": "https://www.foo.com/content.js", | |
| "columnNumber": 30, | |
| "condition": "" | |
| } | |
| } |
By switching to this publicly documented APIs, we’ve begun the process of shipping a new Microsoft Edge DevTools Preview app which runs in part on EDP. You can read more about the new DevTools Preview app here.
Fostering an ecosystem of Microsoft Edge DevTools
By decoupling the client from the platform, we’ve started the work to achieve our second goal of enabling an ecosystem of devtools which support Microsoft Edge. HTTP and WebSocket are ubiquitous technologies in native and web development environments. This means clients written in many programming languages can integrate. We hope this vastly reduces the barriers to entry for those who want to build devtools for Microsoft Edge.
In addition to calling APIs, from within those tools developers will need a way to launch the Microsoft Edge DevTools Server. We’re excited to announce that in the April 2018 update, we’ve introduced a new command line parameter and Edge UX for doing that. Check out the capture below for a preview of that experience:
These command-line parameters for launching the Microsoft Edge DevTools Server, along with available HTTP and WebSocket APIs, can be found in the Microsoft Edge DevTools Protocol documentation. Combined, these capabilities enable developers to more easily build devtools which target Edge.
To prove the viability of this approach, we on the Web Platform team partnered with the Visual Studio and Visual Studio Code teams to support F5 debugging of JavaScript running in a Microsoft Edge tab. We look forward to sharing more on that front soon!
Supporting remote debugging
In addition to wanting to foster a community of devtools which target Microsoft Edge, we want to enable those tools to target Microsoft Edge running on a remote Windows device. Though this specific scenario is not yet supported, it shows our long-term thinking:
Imagine you’re a HoloLens developer working with WebVR. Trying to debug your web app in Microsoft Edge on the HoloLens would likely be a time-consuming activity. Without a mouse and keyboard, navigating of devtools would be a cumbersome experience. Much better would be to run devtools on your local dev machine and remotely target Microsoft Edge instances running directly on the HoloLens.
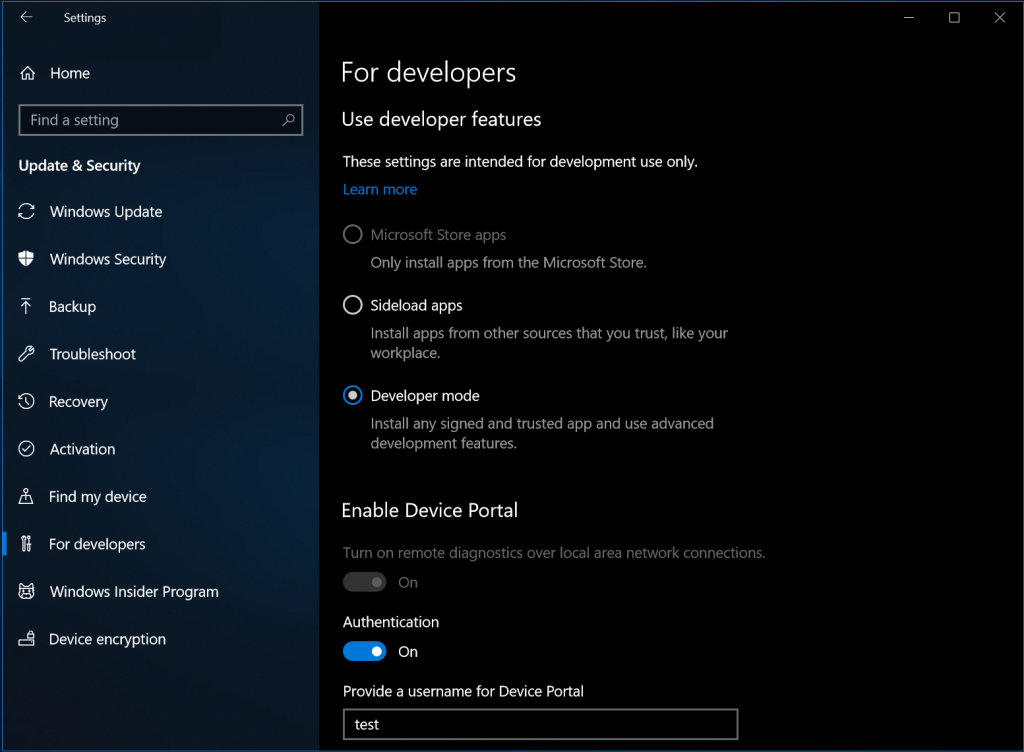
To accomplish that, we built a plugin for the Windows Device Portal (WDP) which hosts the same Microsoft Edge DevTools Server that runs locally when launched via the command-line utility explained above. When you enable WDP in the Windows For developer settings, this will automatically install and activate the EDP plugin.
Using the Remote tab in the new Microsoft Edge DevTools preview app, you can connect to a remote device, view its targets, and connect to and debug them. You can read more about that here and here.
Note: At this point we support remote devices (and virtual machines) running the Windows 10 April 2018 Update or higher on PCs.
Aligning with the devtools protocol community
When we set out to build the devtools protocol for Microsoft Edge, we had a choice: build something which aligns with industry precedents or create our own approach tailored for our browser. The choice was obvious to us so we opted to align with the Chrome DevTools Protocol (CDP).
In the early winter of 2017, we met with fellow web experts from Google, Mozilla, Apple, VS Code, and others to discuss how better to align our work around devtools protocols. The result of that discussion is the DevTools Protocol Web Platform Incubator Community Group (WICG). Through this new group, we hope to publicly explore what alignment looks like and how best we as devtools protocol vendors can benefit the community.
Separate from the WICG, we’ve worked hard as we’ve implemented EDP to validate that our API surface and method/event semantics mirror CDP. By releasing version 0.1 with support for three clients (Visual Studio Code, Visual Studio, and Edge DevTools preview app), we’ve achieved a high degree of interoperability. Where needed due to platform differences, we’ve introduced Microsoft Edge-specific methods and properties, all prefixed with ms and safely ignorable by any client not requiring them.
Lastly, though we’ve committed to testable interoperability, we know there will be bugs, and we hope you will help us find them! We look forward to your feedback as you build great devtools using EDP.
Next steps
This release is the first major step on a multi-milestone journey. We’re passionately committed to building the best Microsoft Edge developer tools and platform APIs to enable our customers to be more efficient and to fix bugs in Microsoft Edge. In terms of what’s next for EDP, here’s a quick look:
- More devtools: we have more features to migrate to EDP within the Microsoft Edge DevTools, and are actively migrating the most-used tools to the new APIs. In parallel, we’re investigating how tools like Sonarwhal and WebDriver can integrate, as well.
- More devices: the first release supports Windows Desktop SKU devices (including VMs of that flavor), and we plan to expand the Windows SKUs and devices supported for remote debugging.
- Interop improvements: as more devtools on-board and we grow our API surface, we’ll continue to invest in ensuring we’re working with the larger DevTools Protocol community to align our efforts.
That’s a rough and quick run through our thoughts about the future. We’ll continue to evolve these priorities as we interact with our developer communities to build new platform capabilities together.
Providing feedback
If you’d like to provide feedback, we’d love to hear it and recommend several channels:
- Feedback Hub: You can file feedback using the Microsoft Edge category and the Developer tools sub-category in the Feedback Hub app on Windows 10—just press Win+F to get started. Whether it’s a bug or suggestion, this is the easiest way for us to receive, track, and communicate around issues you bring to our attention.
- Edge DevTools UserVoice: We monitor and use requests as an important signal informing what we do, and to help prioritize the order in which we implement new features. Please add requests or upvote your favorites.
Thanks for taking the time to learn about the new Microsoft Edge DevTools Protocol and our vision for a rich ecosystem of Microsoft Edge devtools. We hope you’re as excited as we are. Happy coding!
– Brendyn Alexander, Senior Program Manager