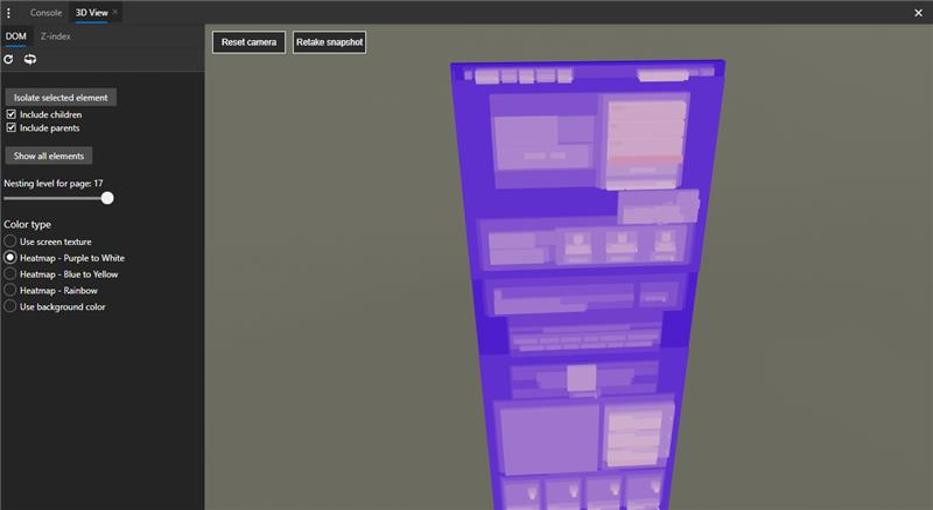
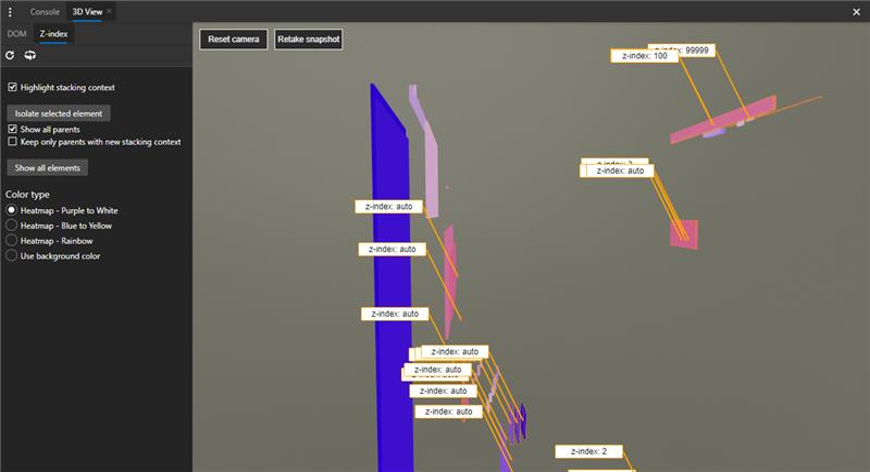
We are thrilled to announce the next iteration of 3D View in the Microsoft Edge DevTools, with a new feature to help debug z-index stacking context. The general 3D View shows a representation of the DOM (Document Object Model) depth using color and stacking, and the z-Index view helps you isolate the different stacking contexts of your page.
3D view is enabled by default in the Canary branch – to enable it in other branches, open the DevTools “Experiments” settings (DevTools -> Ctrl-Shift-P -> “Experiments“) and turn on “Enable 3D View.” If you don’t see the “Experiments” section, navigate to edge://flags and make sure you have enabled “Developer Tools experiments.” Once 3D view is enabled, you can find it under the DevTools “More tools” menu (or via search: DevTools -> Ctrl-Shift-P -> “3D View“).
With our first 3D View experiment, we were able to get incredible feedback from Twitter and from the feedback button. This encouraged us to conduct further usability studies to improve the tool. Along the way, we received plenty of requests for CSS z-index debugging as a feature, and felt that the 3D View would be a great vehicle to try it out.
In the z-index tab you can further simplify the view by only showing elements with a stacking context or hiding elements with the same paint order as their parent. These two settings will make for a flatter and more readable experience. Check out our explainer for more details!
What’s next
Coming soon, we’ll have a better highlighting experience between the Elements panel and 3D View, UI improvements, and new camera controls. We’d love to hear what else you’d like to see from this experience! What other features would help you with your day to day debugging? Feel free to reach out to us on Twitter, or just click “Send feedback” in the Microsoft Edge “Help and Feedback” menu at any time.
– Erica Draud, Program Manager, Edge DevTools


