

With Service Workers, you are in control of telling the browser what to load from the internet and what to get from the local device. Adding service workers to your app allows you to add offline support without breaking the site for legacy browsers – following the principle of “Progressive Enhancement” that makes up the “Progressive” in Progressive Web Apps (PWA).
Service Workers enable you to create better apps, but they can also be overwhelming. We worked closely with web developers to find opportunities to simplify the experience of debugging Service Workers. Based on these conversations, we’ve rolled out new improvements to Service Worker debugging that are available in Microsoft Edge 88, now in the Stable channel.
When debugging them in the Network and Application panes, we found that it was challenging to find enough details to efficiently find the root of the problem. For example, your web application might be suffering from seconds-long latency costs from network requests that could be replaced with milliseconds using service workers. Our new debugging tools can help you find the right balance for your project.
You can learn more about your Service Workers and the network requests that pass through them with our docs on Service Worker improvements in the Network, Application, and Sources panes. With these changes, you can:
- Debug based on Service Worker timelines:
- startup of a request
- registration updates
- fetch event handler execution
- fetch events executed in loading a client.
- Explore the execution details of fetch event handlers and lifecycle event handlers for Service Worker install and activate events.
- Step into and out of fetch event handlers with page script information.
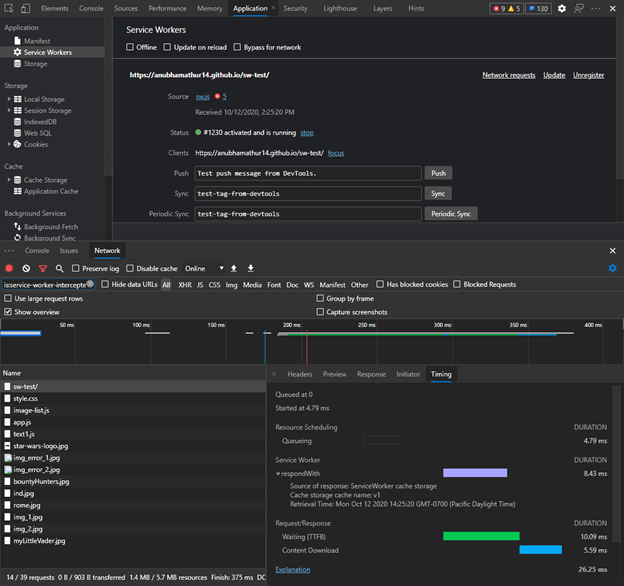
Try Service Worker improvements to the Network pane
- Navigate to the web application you are debugging.
- Head to the DevTools (F12) and go to the Network pane.
- Select the Service Worker network request you’re interested in investigating.
- Pick the Timing tab and scroll to find the Service Worker timeline with the startup and respondWith fetch event timeline.
Try Service Worker improvements to the Application pane
- Navigate to the web application you are debugging.
- Head to the DevTools (F12) and go to the Applications pane.
- Select the Service Worker you’re interested in investigating.
- Pick the Network requests link.
- The Network pane will pop open in the console drawer, displaying the network requests that went through the Service Worker selected.
- Select the Service Worker network request you’re interested in investigating.
- Pick the Timing tab and scroll to find the Service Worker timeline with the startup and respondWith fetch event timeline.
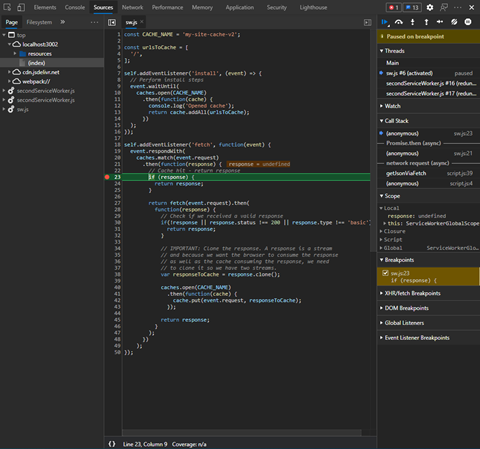
Try Service Worker improvements to the Sources pane
- Navigate to the web application you are debugging.
- Head to the DevTools (F12).
- Go to service worker script in Sources panel or by clicking on the “source” in the Service Workers tab of the Application pane.
- Setup a break point in fetch event handler in service worker script.
- Make the fetch call from web application, the script should stop at the breakpoint and should be able to see the complete stack trace in call stack panel.
What’s next
The Service Worker update lifecycle will be released in Canary soon, so look forward to that announcement! Additionally, we plan to further develop the Cache detail and are investigating more ways to improve the Service Worker debugging experience for Progressive Web Application (PWA) developers. Hit the Feedback button in the DevTools, or find us on Twitter to share your thoughts.
If you’d like to learn more, please check out our documentation, too. We worked in collaboration with the Chromium team, check out some of the technical details in the discussion on this chromium bug.
– Erica Draud, Program Manager, Edge DevTools
– Songtao Xia, Senior Software Engineer, Edge DevTools
– Chait Pinnamaneni, Software Engineer, Edge DevTools