Performance is essential to your success, which makes it core to ours. To help ensure the browser doesn’t slow you down, we always keep performance in mind as we continue to improve Microsoft Edge. We’re also working to help you understand how Microsoft Edge is using the resources on your device to deliver fast, efficient web browsing.
Let’s imagine that one day you are browsing the internet and suddenly your computer starts to slow down, your fan turns on and your computer gets hot. You’re not sure what’s causing the issue, so you open Windows Task Manager to try and diagnose the issue. When you open Windows Task Manager, you struggle to understand what is using your browser’s resources, so you find yourself randomly closing tabs in hopes that it will fix your performance issue.
Not understanding what is happening on your computer can be a very frustrating situation and we want to improve this experience for you while using Microsoft Edge. With that in mind, we have made improvements to how Microsoft Edge is represented in Windows Task Manager. The changes are now available to insiders who are selfhosting Windows 11 and are in the Edge 94 Stable release. Our goal with these improvements is to allow you to better understand where your resources are going and to help you make educated decisions when you experience a performance issue.
Improvements for Microsoft Edge in Windows Task Manager
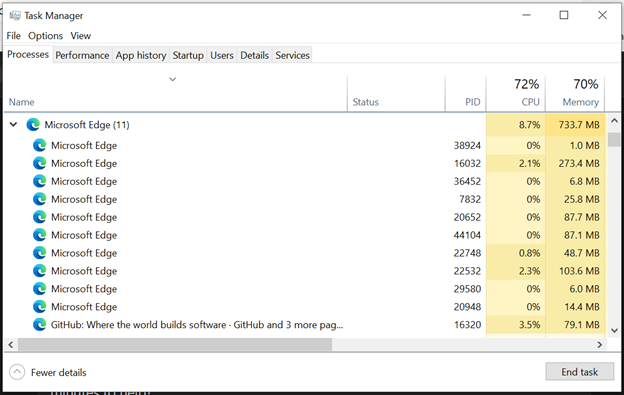
Currently, when you open Windows Task Manager and expand Microsoft Edge on the Processes tab, you see a list of processes named Microsoft Edge.
This is what it currently looks like:
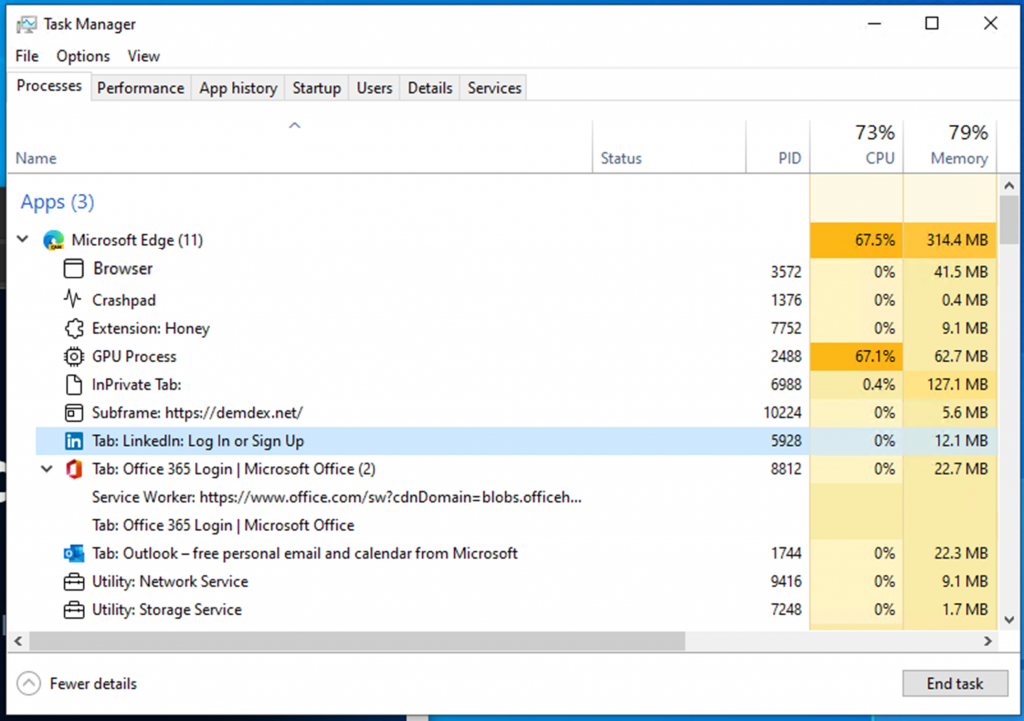
With the latest improvements to Windows Task Manager, you will now see a detailed view of the Microsoft Edge processes. If you are unfamiliar with Microsoft Edge’s multi-process architecture, you can find an easy to understand explanation here. In this blog post you will learn why Microsoft Edge has multiple processes running, what the purpose of each process is, and the benefits of a multi-process architecture.
This is how Microsoft Edge is represented in Windows Task Manager, with the latest improvements:
The improvements include:
- For the browser process, GPU process and crashpad process, you will see the process type with a descriptive name and icon (such as “Browser,” “GPU Process,” or “Crashpad.)
- For the utility, plug-in, and extension processes, you will see the process type and the name of the service, plug-in, or extension.
- For renderer processes:
- For tabs you will see the word ‘tab’, and the site name and icon (Note: For InPrivate tabs, site name will be removed and icon will updated to a default tab icon)
- For subframes (typically used for ads), you will see the word ‘subframe’, followed by the subframe’s URL
- All dedicated workers and service workers will be listed
Rows under Microsoft Edge in Windows Task Manager are not always a separate process. Some processes contain multiple items and will be represented by multiple lines in Windows Task Manager.
There are multiple ways to distinguish which items are in their own process and which items share a process.
Identifying single items in a process
Items that correspond to a single process have no arrow next to the icon.
When clicked, only one line is highlighted.
Each line will have its own resource usage.

When “End Task” is clicked, the single highlighted row will be closed.
Identifying multiple items sharing a process:
An arrow next to the icon indicates that the item shares a process with other items. At the end of the title, there will also be a number in parentheses indicating how many other items share that process. The arrow can be clicked to expand the process
When the process is collapsed, the arrow points to the right and you will only see one of the items in the process.
![]()
When the process is expanded, the arrow points down and you will see all the items that share a process with that item (items that are revealed once the arrow is clicked will not have an icon next to it).
When clicked and the process is collapsed, only one line is highlighted.
When clicked and the process is expanded, all the items that share a process are highlighted.
Since multiple items share a process, the item that has the arrow next to it will show you the total resource usage for that process. When expanded, the resource usage for the remaining rows will remain blank.
When clicking ‘End Task’, all rows that are highlighted when a process is expanded will be closed. You can only close processes, not individual items in Windows Task Manager.
Ending tasks
When ending tasks, depending on the process that you are ending, you will see different behaviors. A few examples of what you may see are:
- Browser process: All processes related to that instance of Microsoft Edge will close.
- GPU process, utility processes: Processes will close and restart. When the processes close, you may see a brief change in your Microsoft Edge window. For example, when the GPU process is closed, your Microsoft Edge window will briefly go black and will return to normal once the process is restarted and when the audio utility process is closed, if you are listening to music, your audio will briefly stop and will return to normal once the process is restarted.
- Renderer processes: Process will close. If the process contains tabs, all the tabs in the process will be replaced with an error page saying, “This page is having a problem.” If the process contains subframes, the visible subframes will be replaced with a crashed tab icon. For invisible subframes, you likely won’t see a difference, but the page may be affected in some way.
- Extension and plug-in processes: A balloon will appear in the bottom right-hand corner of your screen saying the extension or plug-in has crashed and will ask you if you would like to reload the extension or plug-in.
- Crashpad processes: Process will close. Crashes in Microsoft Edge may be reported by other means.
- Dedicated workers/service workers: Functionality of a tab may break.
Improvements to the Browser Task Manager
If you are familiar with the Task Manager in Microsoft Edge, which can be opened by pressing Shift+Esc while in Microsoft Edge or by going to the top corner of the browser and selecting Settings and more (…) > More tools > Browser task manager, you will see that the improvements made to Windows Task Manager look similar. We wanted to provide the same level of detail in Windows Task Manager as we do in Browser Task Manager to help you better understand where your resources are going and to help you make educated decisions when you experience a performance issue.
One thing to note is that Windows Task Manager shows a different memory value than Browser Task Manager. If you want to learn more about what each value represents, we explain this in detail in the blog post How to investigate Microsoft Edge’s memory usage on Windows and if you are generally interested in learning more about how your browser manages memory, you can learn more here.
Trying out the changes
The changes are now available to insiders who are selfhosting Windows 11 and are in the Edge 94 Stable release. If you are interested in trying out the improvements and you are not a Windows Insider, you can sign up to become one here and you can find the official Windows announcement here.
We would love to hear about your experience troubleshooting Microsoft Edge with the improvements made to Windows Task Manager. If you would like to share your experience/feedback, you can do so by right clicking anywhere on Microsoft Edge in Windows Task Manager and then clicking ‘Provide Feedback’. This button will launch the Windows Feedback Hub. You can also submit feedback directly through Microsoft Edge by going to Settings and more … > Help and feedback > Send feedback or by pressing Shift+Alt+I on a Windows device after you’ve clicked on your browser window.
We hope you enjoy these improvements and look forward to hearing from you!
– Allison Pastewka, Program Manager, Microsoft Edge


