Any sufficiently large web application will probably reach the point where it uses more memory than expected. At that point, a developer might start recording memory heap snapshots in DevTools to investigate what objects are contained in memory. For any object listed in the snapshot, DevTools shows, in the Retainers pane, what other objects cause it to remain in memory. Any object with no retainers can be discarded by the browser’s garbage collector, which reduces memory usage.
However, the Retainers pane is only useful if it works correctly. Over the past several months, we have received several excellent bug reports from Microsoft Teams engineers describing cases where DevTools showed retainers that simply made no sense, and there was no way that a web application developer could take any action to remove those retainers. Thank you to everyone who brought these issues to our attention. We’ve fixed those bugs (details below), but of course there may be others, so if you see something that seems wrong, please speak up! The easiest way to get in touch is the feedback button in the devtools:
Before we get started, note that although several things below refer to Microsoft Edge, the problems we fixed were in the browser’s JavaScript engine’s code (V8). This code is shared with Chrome, Electron, Node, and others, so all those products will benefit from the fixes.
Swimming in false retainer paths
Suppose you were working on the Microsoft Edge new-tab page (edge://newtab) and wanted to know why the function named observe() is being kept alive. You would hit F12 to open DevTools, navigate to the Memory tab, and select the relevant object in the top pane. In Microsoft Edge version 94, you would see four retainers for that function:
The shortest path goes through a FeedbackVector, an internal data type which collects data about what functions have been called by another function. Expanding that path a little more, you would see that the FeedbackVector is owned by another function, HTMLElement.attachShadow():
So, there’s this function which retains some internal V8 goo that you have no control over which, in turn, retains the original function observe(). How can you possibly break that link, since it’s all V8 internals?
You can’t, which means there’s a bug. Either V8 is leaking memory, or the Retainers pane is incorrect, and both are serious high-priority issues for us. In this case, the problem was that Microsoft Edge showed incorrect retainers. We have fixed this issue in Microsoft Edge 99. Here is the correct answer list of retainers:
Because the Retainers tree is both deep and wide on large apps, the number of false paths completely blocked many memory usage investigations. This problem was so pervasive that our friends at Microsoft Teams have been using a workaround which captures additional information during V8’s garbage collection phase and highlights a single retainer path which is actually known to be true.
Keeping it fixed
It’s very important that developers can trust DevTools, so we are working on an automated solution to prevent regressions that introduce new false retainer paths. Based on the insight from Microsoft Teams that the heap snapshot needs to match the garbage collector’s marking behavior, we have proposed validation code that compares the outgoing edges for each node in the heap snapshot versus the objects visited by the actual garbage collection code and crashes the process if there is any mismatch.
This validation will be included in debug builds (including those that we use for daily automated testing), so we can quickly find and fix any problems that cause a mismatch between the snapshot and the garbage collector’s behavior.
Deoptimization data
Microsoft Teams engineers found that some large object graphs were retained by objects named “(code deopt data)”, like in the following screenshot:
Just like the false FeedbackVector paths, DevTools in this case indicate that a JavaScript function retains some V8-internal objects, over which the developer has no control, which in turn retains another JavaScript function. Unlike the previous case though, here DevTools accurately depicted what was happening within V8, which was a memory leak. We have fixed this leak in Microsoft Edge version 98.
Finalization registries
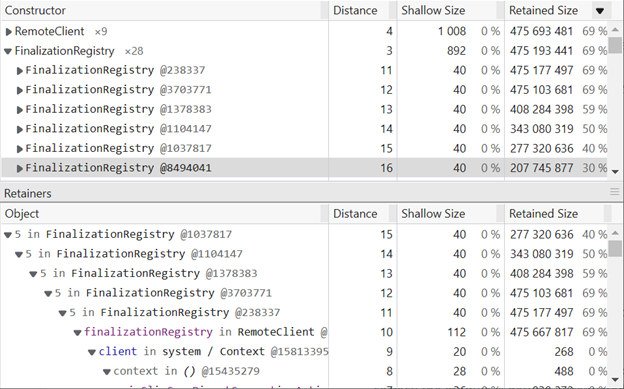
In yet another excellent report from Microsoft Teams, we saw that a bunch of FinalizationRegistry objects were retained directly by other FinalizationRegistries, and causing high memory usage:
This turned out to be another V8-internal memory leak, which we’ve fixed as well.
In closing
We care about ensuring that web developers have the tools they need to diagnose and fix memory usage problems. At the most fundamental level, that means that the JavaScript engine needs to not leak memory and accurately represent the heap state when taking snapshots for DevTools.
We are committed to ensuring that everything shown in the Retainers pane is true, and that V8 doesn’t have internal memory leaks. We’ve fixed the problems that we’re aware of, but please let us know if you see others.
– Seth Brenith, Senior Software Engineer, Microsoft Edge


