

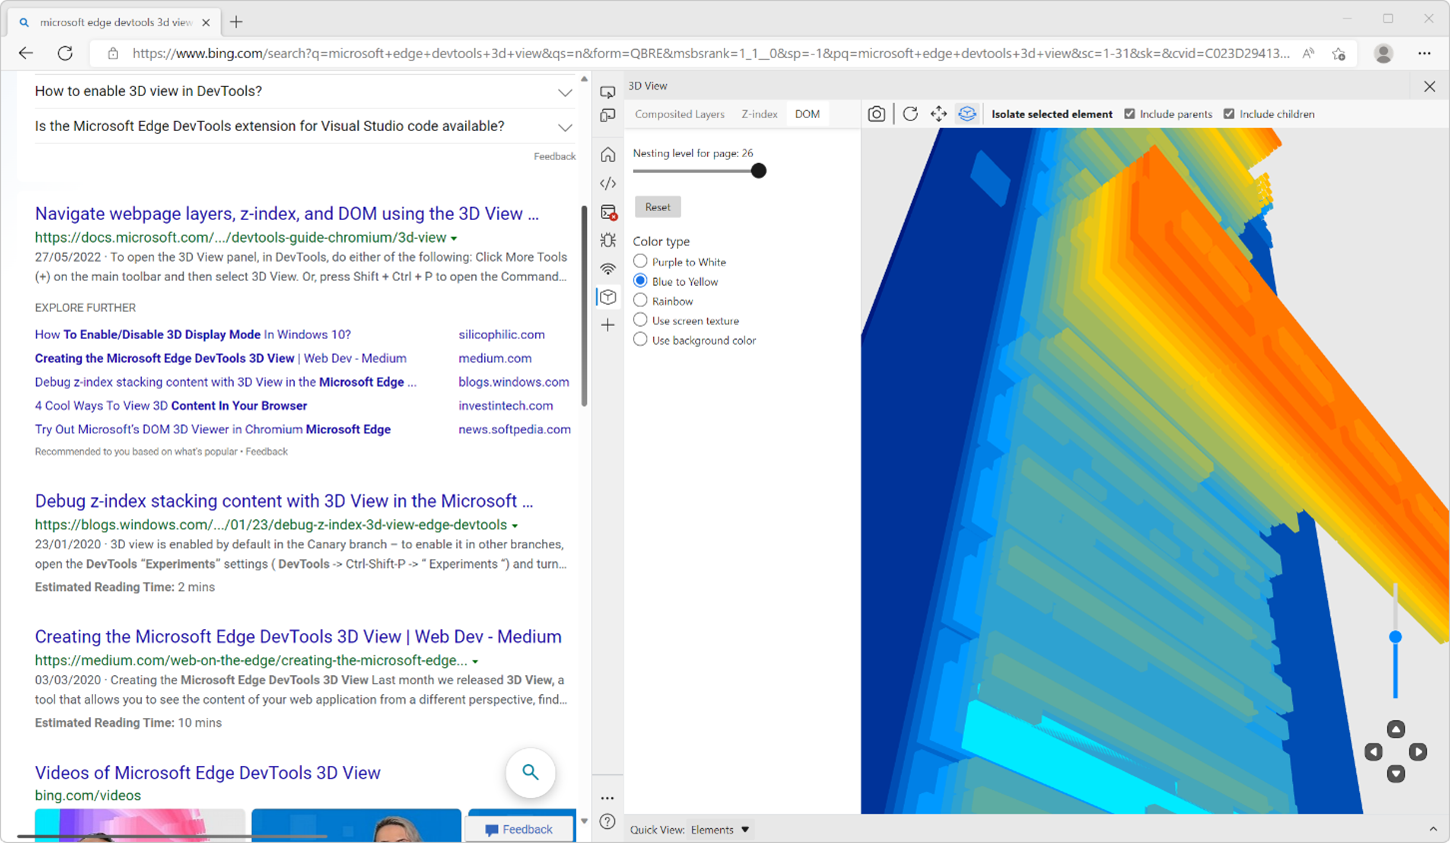
Microsoft Edge DevTools has had a 3D View tool for some time already, and it’s a really great way to visualize how web pages are constructed.
The tool is becoming even better! We’ve recently added new functionality to it and updated the navigation interface to make it more powerful and easier to use.
In this article, we’ll look at some of the great ways you can use the 3D View tool to solve common web development problems such as DOM complexity, unwanted scrollbars, or z-index stacking issues. And then we will go over a new performance improvement capability we just added.
Solving common problems, faster
For web developers, being able to visualize a web page in three dimensions can be very useful. Let’s review a few use cases when the 3D View tool comes in handy.
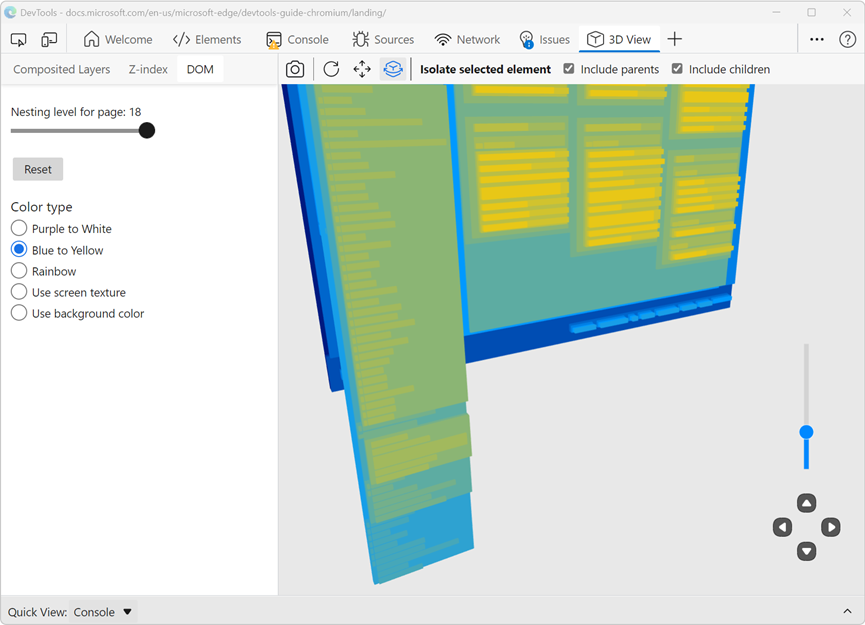
Find out how complex a page is
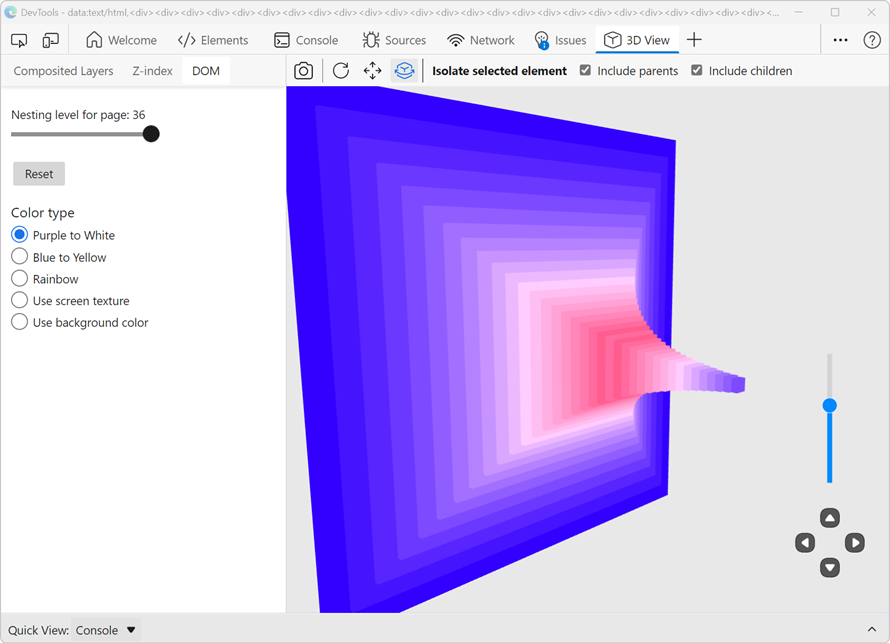
Sometimes, extra HTML <div> elements are used to achieve a certain style, or make a JavaScript-based feature work. But things can quickly get out of hand, and it’s not uncommon to end up with DOM trees that are very deeply nested.
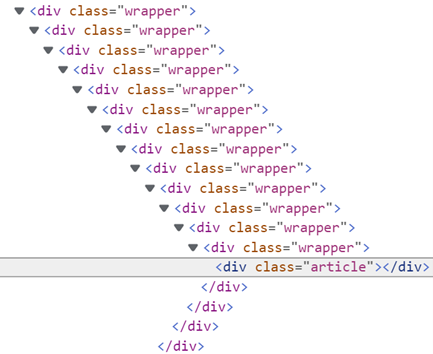
This can make it much harder to work on the HTML code of your page, as well as debug it. But it can even have performance implications. The more the DOM tree grows, the longer the browser will need to re-calculate styles when things change.
The 3D View tool is a fast way to find these deeply nested containers. Select the DOM tab of the 3D View tool to see the DOM tree in 3 dimensions and discover which part of your page may have too many wrappers.
Quickly spot out-of-viewport elements
Sometimes, elements end up outside the visible browser viewport.
Whether you’ve positioned an element there because you plan to transition it in the page later, or whether it was by accident, finding them in DevTools can prove quite hard.
You can’t use the element picker to select them in the page, they’re just not reachable. Using right-click > inspect is also not an option in this case, and using the Elements panel to find them may be difficult.
There is a much faster way to do this by using the 3D View tool. The DOM tab of the tool gives you an overall view of the entire web page and allows to zoom out and pan around the scene until you find the elements that are out of the viewport. Click one of the elements to jump to the Elements tool.
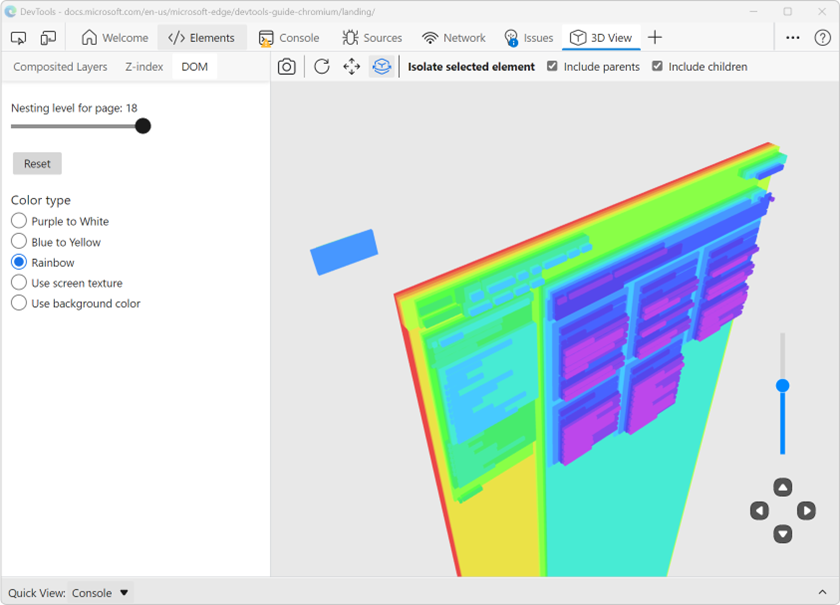
In fact, this ability to zoom out to reveal elements that are outside of the viewport can also prove useful to debug unwanted scrollbars too.
Unwanted scrollbars are one of the most frustrating issues when working with CSS. Sometimes content overflows in ways we don’t want it to and this may lead to scrollbars appearing.
When scrollbars appear, one of the most important things to do is finding out which elements in the page are overflowing. With a large and deep DOM tree, this is not always an easy task to do.
The 3D View tool can help do this much quicker. By panning around the scene in the DOM tab and zooming out, you can discover which elements stick out of the main page container and cause scrollbars.
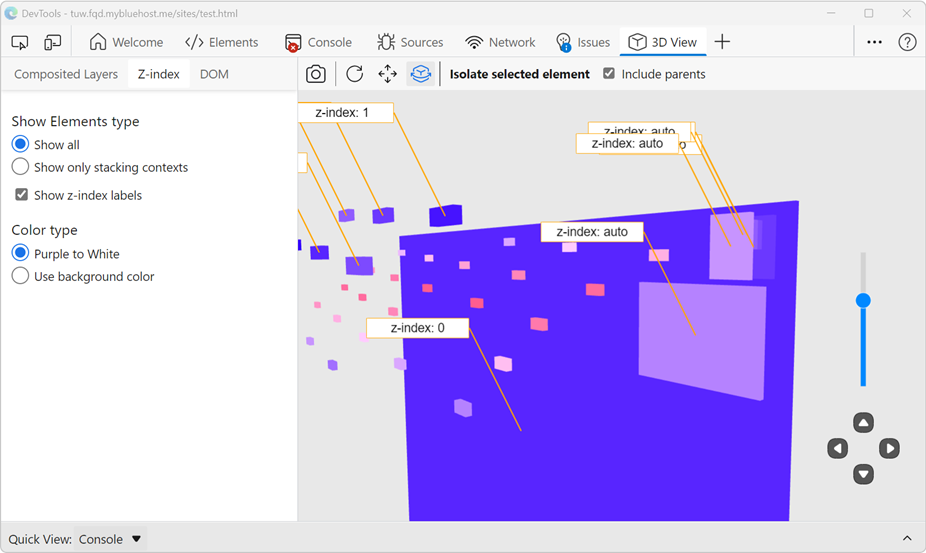
Debug z-index stacking issues
Cases when modal dialogs, tooltips, or drop-down menus compete for the highest z-index on a page are also quite common and frustrating. Finding out the root cause of such a problem requires a good understanding of what a stacking context is, and what makes an element be one. Often, arbitrarily high z-index values are used to fix the issue, but that does not always work.
The 3D View tool has a Z-index tab that makes investigation much easier. The tool makes it possible to see which elements are stacking contexts and how elements are stacked along the z-index axis.
As we just saw, the 3D View tool is great at quickly spotting common issues and getting you on a path to fixing them. But recently, we have made the tool even more powerful.
Debug performance issues with Composited Layers
We introduced a new tab in the 3D View tool, Composited Layers, which helps make sure a web page is broken down in the correct number of layers to have great performance when pieces of it are animated or changing independently of the rest.
To understand how layers occur on the web and why they’re important, it’s necessary to know how browser rendering engines work, at a high-level. To go from HTML and CSS to pixels on a screen, a browser engine needs to go through multiple steps:
- Parse the HTML code and build the DOM tree of the page.
- Parse the CSS code and get the style and layout information for the page.
- Using the above, create a new tree structure that describes the layout of the page, i.e., where, and how big each element on the page is.
- Finally, paint the page to the screen by using the layout and style information.
During this last step, the engine may decide to paint the page in one go, or to divide it into multiple layers, paint them individually, and then compose the final image from them. There are specific CSS properties and HTML elements that make the engine decide to create a separate layer. For example, using a 3D transform property or the will-change property makes the engine create layers. This way, when content in these layers change, the engine only has to re-paint these individual layers and not the entire viewport.
As a web developer, it can be very useful to know if a part of the page that you intend to animate is, indeed, in its own layer. If it is, then you can be sure that while the animation is playing, the rest of the page won’t need to be repainted too. But it’s equally important to check that you aren’t accidentally creating too many layers either, as each one needs memory.
In the 3D View tool, select the Composited Layers tab to discover the layers that were created.
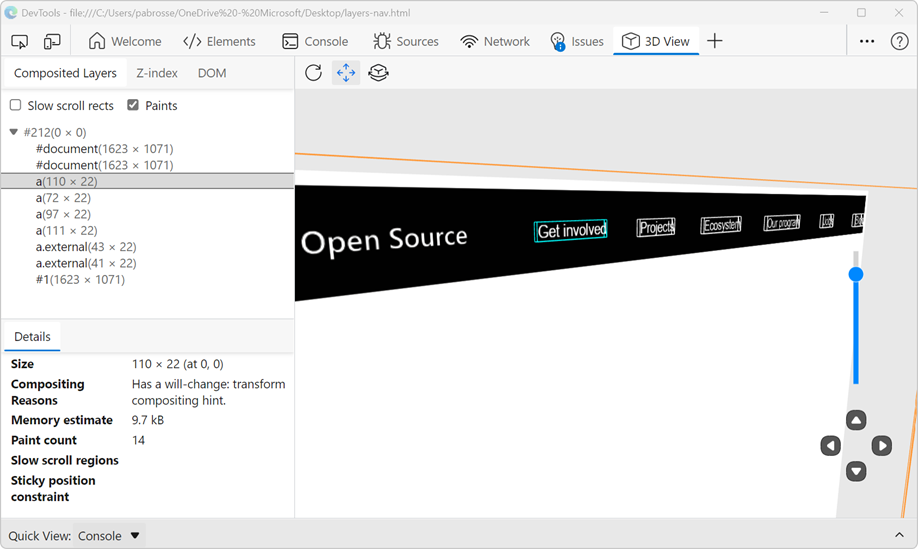
In the sidebar on the left-hand side, the list of layers is displayed and hovering over each of them highlights it in the 3D scene. Click on a layer to discover details about it in particular: its size (the bigger the size, the more memory will be needed) and the reasons why it was created.
On a related note, Microsoft Edge DevTools used to have a separate Layers tool which supplied the same functionality. We merged it with the 3D View tool to reduce the total number of panels, to make it easier to discover, and to make it a more consistent experience.
You can learn more about the 3D View tool on our documentation: Navigate webpage layers, z-index, and DOM using the 3D View tool, and watch this video for more information.

We’re constantly improving the tools in Microsoft Edge, like the 3D View, and we are on a path to making DevTools a radically more user-friendly product, based on your feedback. If you have any suggestions or ideas about anything related to DevTools, you can send us feedback on our DevTools repository.
We hope you enjoy the 3D View tool!
– Patrick Brosset, Senior Product Manager, Microsoft Edge