

If you’re a web developer, you may have already heard that some CSS selectors are faster than others. And you’re probably hoping to find a list of the better selectors to use in this article.
Well, not quite. But bear with me, I promise that by the end, you’ll have learnt something new about CSS selector performance.
A quick look behind the scenes
The way you write CSS selectors does play a role in how browsers render your web pages.
Whenever a part of your page changes, the browser engine that’s running it needs to take a look at the new DOM tree, and figure how to style it based on the available CSS stylesheets. This operation of matching styles to DOM nodes is called a style recalculation.
Without getting into a lot of details, the browser engine needs to look at all your rules and make decisions as to which ones apply to a given element. To do this, the engine needs to look at the rule selector, and this happens from right to left.
For example, when the engine sees a selector like `.wrapper .section .title .link` it will try to match the `link` class with the element first, and if that matches, then go up the chain from right to left to find an ancestor element with class `title`, then one with class `section`, and finally one with class `wrapper`.
This example illustrates that it’s likely faster for the browser engine to match just `.link` than it is to match this longer `.wrapper .section .title .link` selector. There are just fewer things to check.
Classes aren’t the only type of identifiers you can use in your CSS selectors of course. One interesting example is using attribute selectors and do substring matching like `[class*="icon-"]`.
This type of selector requires the browser engine to not only check if the element has a class attribute but also whether the value of this attribute contains the substring `icon-`. That’s another example of how different ways of writing selectors may require more or less work for the engine to apply CSS rules.
In practice, does it matter?
Maybe. This heavily depends on the web page, the size of the DOM tree, the amount of CSS rules, and whether the DOM changes often. There’s unfortunately no rule around this.
In fact, talking about rules, as an industry, we like inventing rules for what’s good and what’s bad. Rules help us make quick decisions and guide us when writing code and designing software. But they can also blind us from what’s really happening in our specific case.
When it comes to writing CSS selectors, strictly applying rules, or using a linter to do it automatically, may actually be counter-productive in some cases.
Overly complex CSS selectors, coupled with a huge DOM tree that changes a lot could very well lead to bad performance. But there’s a balance. Over-indexing on theoretical rules and changing selectors just to please your linter and hope for better performance may just be making your CSS harder to read and maintain, for not much actual gains.
So, write the code in a way that makes sense for your app, and is easy to read and maintain, and then measure the actual performance of your important user scenarios.
Measure!
Prefer measuring your key app scenarios over blindly applying a set of rules for how to write fast code. Know the tools at your disposal, and use them.
Microsoft Edge DevTools has a Performance tool that can be a real eye opener when your app starts feeling slow.
I want to emphasize the word feeling here. Build empathy for your users and use the devices they actually use if you can. Your development machine is likely much more powerful than your users’ devices.
In fact, one nice thing you can do with DevTools is slow down your CPU and network connection from within the tools directly.
The Performance tool can look quite complicated, but we have documentation that should help. Also, everything happens in your browser only, so you can try things out without breaking anything, and you can always just reload the page and re-open DevTools if you get into trouble.
Learn to use the tools available to measure your key scenarios, and learn to identify the biggest blocks that are making things slow.

If style recalculation is, indeed, one of the things that is making your app slow, then we’ve got good news for you. When it comes to investigating a performance issue you’ve zeroed in on, nothing beats having a tool that just gives you the root cause for it immediately.
Selector stats to the rescue
Starting with Microsoft Edge 109 the Performance tool in DevTools can list the most costly selectors in any style recalculation. Here’s how to get it:
- Open the Performance tool.
- Open the tool’s settings by clicking the cog icon in the top-right corner.
- Check the Enable advanced rendering instrumentation (slow) option.
- Click Record, execute the scenario on the webpage that you want to improve, and then click Stop.
- In the recorded profile, identify a long style recalculation that you want to improve and select it in the waterfall view (“Main” section).
- In the bottom tab bar, click Selector Stats.
DevTools now gives you the list of all the CSS selectors that got calculated by the browser engine during this recalculation operation. You can sort the selectors by the time they took to process or the number of times they matched.
If you find a selector that required a long time to process, and was matched many times, that might be a good candidate to try and improve. Could the selector be simplified? Could it be made more specific to the elements it should match?
This new feature makes it instant to go from a suspicious-looking style recalculation to the individual CSS selectors that are causing it to be that long. You can then go back to your source code, improve those particular selectors, and measure again.
Case study
To make things more practical, let’s try to improve an actual webpage. We will use a photo gallery page built as a demo just for this.
This page has a toolbar at the top to filter photos by camera model, aperture, exposure time, etc. and switching between camera models feels a bit slow right now.
Although this demo page was built just for this, it does show a case that’s similar to what we encountered in our own products at Microsoft. The Edge team and other product teams at Microsoft who rely on the web platform collaborate closely in this area in order to create the best user experience. In certain specific scenarios, we were seeing unusually long style recalculations in apps that have a lot of DOM elements (like the demo page we’ll use here, which has around 5000 elements). Having access to the CSS selector stats tool helped us a lot.
The scenario we’ll be focusing on is the following:
- Load the demo page, and wait for the filters to be ready.
- Switch the camera model filter to another value and start the performance recording.
- Switch back to all camera models and stop the recording.
Switching back to all photos is slow so we’re measuring only that part. We’ll also slow down the CPU four times to have more realistic results than we’d normally get on a powerful development machine.
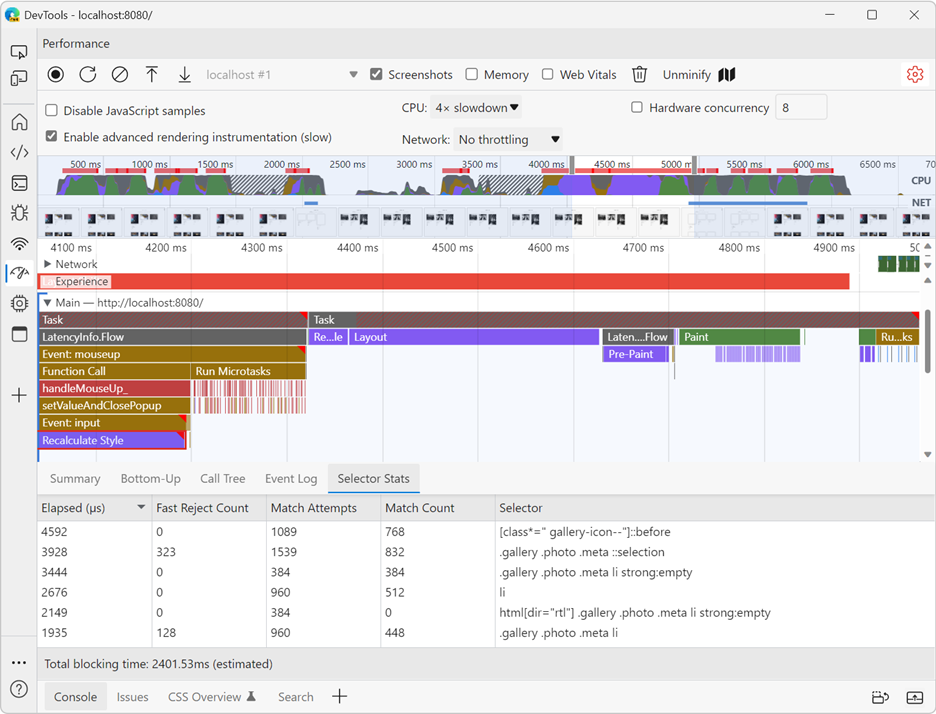
Once the recording is ready, we can easily see a long style recalculation block in the profile, amounting to more than 900 milliseconds of work in my case. Let’s click on this block, open the Selector Stats pane, and then sort by elapsed time:
The more work a selector requires to match, and the more times it’s matched, the more potential wins we can get by improving this selector. In the list above, the following selectors seem interesting to look at:
`.gallery .photo .meta ::selection``.gallery .photo .meta li strong:empty``[class*=" gallery-icon--"]::before``.gallery .photo .meta li``*``html[dir="rtl"] .gallery .photo .meta li button`
Improving the ::selection selector
We use `.gallery .photo .meta ::selection` in the demo web page to style the background and text colors of user selections inside the photo metadata part of the page. When users select the text below a photo, custom colors are used instead of the browser default ones.
This particular case is actually problematic because of a bug in the code. The selector should really be `.gallery .photo .meta::selection` instead, with no extra space between `.meta` and `::selection`.
Because there’s an extra space there, our selector is actually interpreted by the engine as: `.gallery .photo .meta *::selection` which makes it a lot slower to match during a style recalculation because the engine needs to check all DOM elements, and then verify if they’re nested inside the right ancestors.
Without the extra space, the engine only needs to check if the element has a class of `.meta` before going further.
Improving the :empty selectors
The selector `.gallery .photo .meta li strong:empty` looks suspicious at first sight. The `:empty` pseudo means that the selector only matches when the `strong` element doesn’t have any contents.
This might require the engine to do a bit more work than just checking the element’s tag name but is very useful.
However, looking at other CSS rules close to this one, we can see the following:
.gallery .photo .meta li strong:empty {
  padding: .125rem 2rem;
  margin-left: .125rem;
  background: var(--dim-bg-color);
}

html[dir="rtl"] .gallery .photo .meta li strong:empty {
  margin-left: unset;
  margin-right: .125rem;
}
The same selector is repeated twice, but the second instance is prefixed with `html[dir=rtl]` which is useful to override the first rule when the text direction on the page is right to left. In this case, the rtl direction rule overrides the left margin and replaces it with a right margin.
To improve this, we can use CSS logical properties. Instead of specifying a physical margin direction, we can use a logical one that will adapt to any text direction, as shown below:
.gallery .photo .meta li strong:empty {
  padding: .125rem 2rem;
  margin-inline-start: .125rem;
  background: var(--dim-bg-color);
}
While we’re doing this, there are other places in the CSS code that use the same attribute selector which can be improved by using logical CSS properties. For example, we can get rid of the `html[dir="rtl"] .gallery .photo .meta li button` selector we found earlier.
Improving the [class*=" gallery-icon--"] selector
Our next selector is this complicated-looking attribute selector: `[class*=" gallery-icon--"]::before`.
Attribute selectors can be very useful, so before removing them, check whether they’re really having a negative impact. In our case, this selector does seem to play a role.
Here are the CSS rules we use this selector for:
[class*=" gallery-icon--"]::before {
  content: '';
  display: block;
  width: 1rem;
  height: 1rem;
  background-size: contain;
  background-repeat: no-repeat;
  background-position: center;
  filter: contrast(0);
}

.gallery-icon--camera::before { background-image: url(...); }
.gallery-icon--aperture::before { background-image: url(...); }
.gallery-icon--exposure::before { background-image: url(...); }
...
The idea here is that we can assign any of these icon classes to an element and it’ll get the corresponding icon.
While this is a handy feature, we’re asking the engine to read the class value and do a substring search on it. Here is one way we can help the engine do less work:
.gallery-icon::before {
  content: '';
  display: block;
  width: 1rem;
  height: 1rem;
  background-size: contain;
  background-repeat: no-repeat;
  background-position: center;
  filter: contrast(0);
}

.gallery-icon.camera::before { background-image: url(...); }
.gallery-icon.aperture::before { background-image: url(...); }
.gallery-icon.exposure::before { background-image: url(...); }
Now instead of using just one class, we’ll need to add two classes to elements: `<div class="gallery-icon camera">` instead of `<div class="gallery-icon--camera">`. But, overall, the feature is still very easy to use and causes less work for the engine when there are many DOM nodes to re-style like in our demo page.
Improving the .gallery .photo .meta li selector
This selector looks really inoffensive. But, as described earlier, it still forces the browser to go and check multiple levels in the list of ancestors to the `li` element. Knowing that our web page has a lot of `li` elements, this can amount to a lot of work.
We can simplify this by giving our `li` elements a specific class, and removing the unnecessary nesting. For example:
.photo-meta {
  display: flex;
  align-items: center;
  gap: .5rem;
  height: 1.5rem;
}
Improving the * selector
The `*` symbol is used as a universal selector in CSS that matches any element. This ability to match anything means that the engine needs to apply the associated rule to all elements.
As we can see in our performance recording, this selector is indeed being matched many times. It’s worth looking into what the CSS rule actually does.
In our case, it applies a specific `box-sizing` value:
* {
  box-sizing: border-box;
}
This is very common in CSS, but in our case, it actually makes sense to remove it, apply the `box-sizing` only where needed, and then see the gains.
Results
With all of these improvements done, it’s time to check the performance of our scenario again.
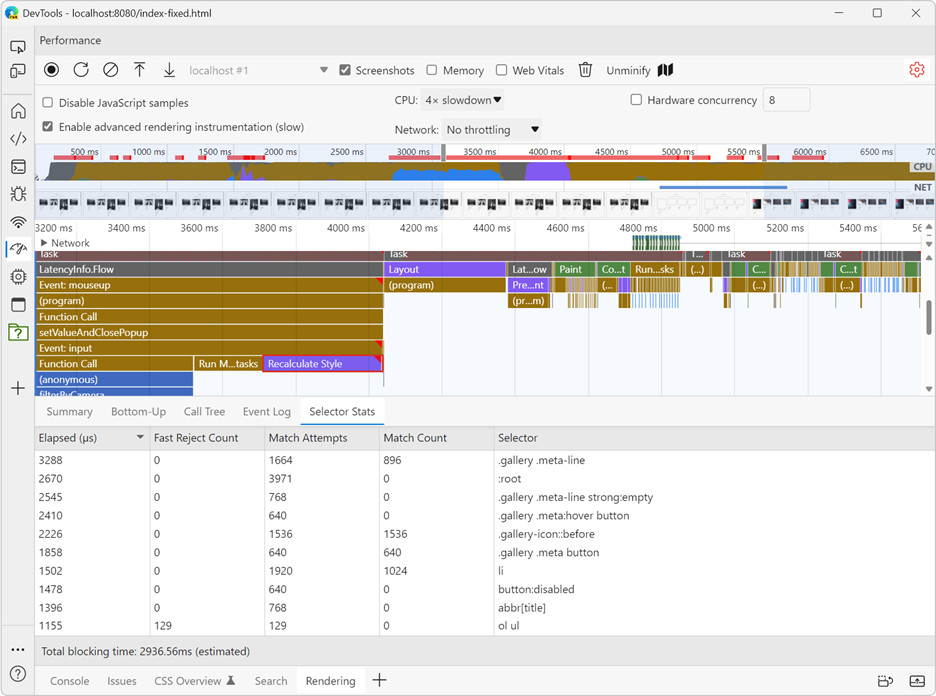
In the above performance recording, the same Recalculate Style block that was taking almost a second to run, is now taking around 300ms to run which a really big win!
Conclusion
The case study showed that improving certain CSS selectors can lead to important performance gains. It’s key to remember, however, that this will depend on your particular use case. Test the performance of your web page using the Performance tool, and if you find that style recalculations are making your scenarios slow, use the new Selector Stats pane in Microsoft Edge.
As always, if you have any feedback for the DevTools team, please reach out to us by opening a new issue on our GitHub repository.