Analyzing website performance with the Windows Performance Toolkit
Slow pages lose users: research from Bing and Google indicates that delays as small as half a second can impact business metrics. To build fast sites, developers need powerful tools to analyze the performance of their sites and debug issues. In-browser tools like the F12 Developer Tools are a great start and the primary tools for analyzing what’s happening behind the scenes when a page slows down. However, some scenarios require measuring performance characteristics in the context of other applications and the operating system itself. For these scenarios, we use the Windows Performance Toolkit.
https://channel9.msdn.com/Events/WebPlatformSummit/edgesummit2016/ES1606/
The Windows Performance Toolkit (WPT) is a powerful tool to analyze both app and operating system performance, and is used extensively by the Microsoft Edge performance team for in-depth analysis. The toolkit includes the Windows Performance Recorder, a tool for recording traces, and the Windows Performance Analyzer, a tool for analyzing traces. It uses a fast, non-impactful trace logging system called Event Logging for Windows (ETW) to sample stacks and collect app or OS-specific events.
Since WPT can record and analyze CPU and memory usage for all Windows applications, WPT can be used for tasks that in-browser developer tools can’t, like analyzing GPU usage, disk usage, and system wide memory usage. In addition, WPT can be used to analyze performance in context of the system – for example, identifying the impact of virus scanners or performing cross-window analysis or measuring across multiple tabs in multiple processes.
In this post, we’ll introduce you to WPT with a very basic step-by-step example, in which we’ll use WPT to debug a simple performance issue. This example and analysis technique can be used with the in-browser F12 Developer Tools as well, but serve as a simple introduction to WPA. In later posts, we plan to explore more sophisticated analysis techniques using the capabilities described above.
Installing the Windows Performance Toolkit
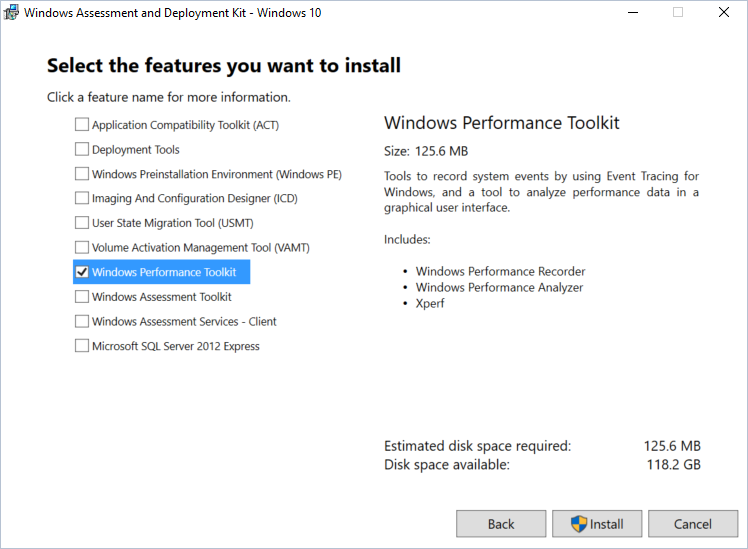
The WPT is available as a component of the Windows Assessment and Deployment Kit, available for free from the Microsoft Dev Center. This kit includes a number of additional tools, however we’ll be focusing on just the Windows Performance Toolkit for the purposes of this post.

Gathering a performance trace
The first step to analysis using WPT is gathering a performance trace. In this step, we’re recording the performance characteristics of activity across the system to identify potential culprits inside and outside of the browser. For the purposes of this tutorial, we built a simple demo page with some artificial performance problems. We’ll use this page for the trace and analysis below.
Prepare Windows Performance Recorder
To minimize noise in the recording, you should close all applications besides the browser tabs you intend to analyze for this step. Launch the Windows Performance Recorder application (installed with the Windows Performance Toolkit”) and select the “Edge Browser” and “HTML Responsiveness analysis” profiles under “More options” (as seen in the screenshot below). These settings will configure Windows Performance Recorder to gather the metrics most useful for Edge performance analysis, including subsystem stack attribution, JavaScript symbols and networking, and frame-by-frame information.

Identify scenarios
Before starting the trace, it’s best to identify the scenarios you’re analyzing and try to keep them as atomic as possible. Imagine a site with performance problems when loading the page (from start of navigation to page load complete), scrolling, and selecting something in a table. In this case it’s best to record traces for each of the three scenarios separately to keep the analysis focused for each issue.
If a scenario involves navigating to a site, consider beginning the scenario at about:blank. Starting at about:blank will avoid the overhead of the previous page. If it involves navigating away from a site, navigate to about:blank to complete the scenario. This will keep the noise of other sites out of the trace unless the specific interaction between sites is the issue under investigation.
In our example, the scenario is a simple page load. We’ll navigate the browser to about:blank, and then navigate to the example page (you can download the sample on the Performance Analysis Test Drive here).
Record and execute scenarios
Once you’re ready to gather a trace for a given scenario, click “Start” to begin recording and execute the scenario you intend to measure. In our example, we’ll simply perform the navigation to our sample page.
As the browser navigates to and loads the demo page, Windows Performance Recorder will collect information about all programs running on the computer while the trace is recording, with minimal impact on active processes. As soon as you’ve finished executing the scenario (page load is complete), click “Stop” immediately and save the trace. This helps minimize the noise in your analysis as well as keep the trace file to a manageable size, as ETL files can get quite large.
Analyzing a performance trace
To analyze the trace, open Windows Performance Analyzer and open the ETL file generated in the previous step. You may need to load symbols for the trace, which can involve a large download. We recommend restricting the symbols loaded to Microsoft Edge and web apps, unless you have a specific additional need. You can do this by selecting “Trace/Configure Symbol Paths” from the WPA menu. Here you can use the Load Settings menu to restrict symbols to MicrosoftEdgeCP.exe and WWAHost.exe (as seen in the screenshot below).

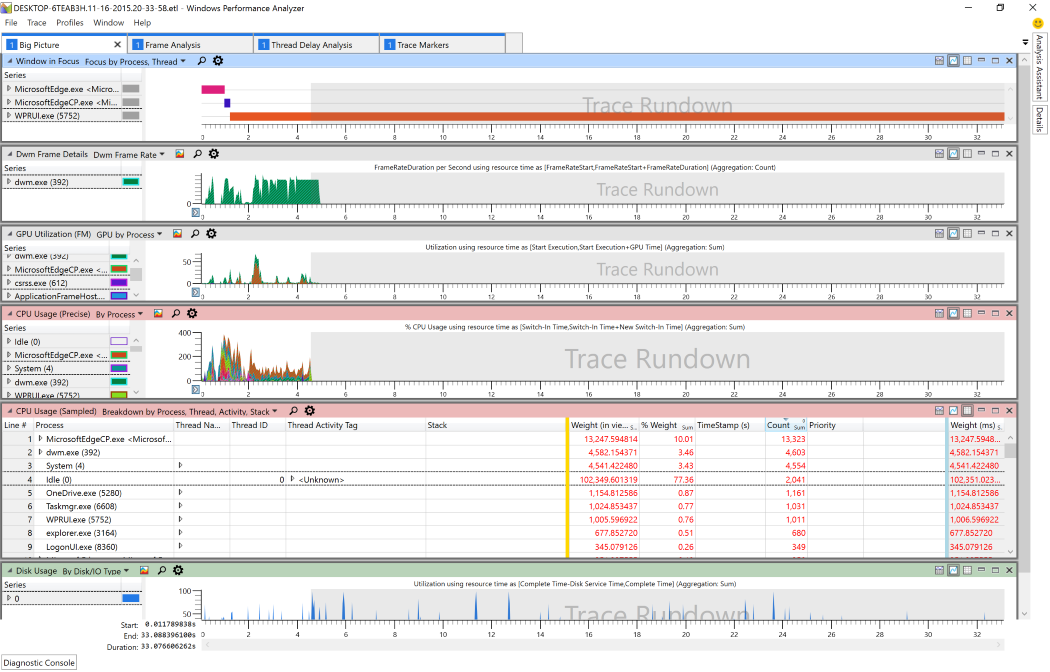
The symbols will be cached to disk and future traces will load symbols much more quickly. After symbols begin loading, apply the HTML Analysis Profile by selecting “Profiles/Apply” from the menu then clicking “Browse Catalog.” Choose HtmlResponsivenessAnalysis.wpaProfile. For nearly all web site investigations, we recommend starting with this profile since it includes the key graphs and tables necessary for analyzing the performance of a website. This profile will configure four tabs (Big Picture, Frame Analysis, Thread Delay Analysis, and Trace Markets) loaded with data and graphs useful for analysis (as seen in the screenshot below).

For more on configuring these views and the functions of each tab, see our “Analyzing a trace” walkthrough on Microsoft Edge Dev. For the purposes of this post, we’ll assume you have the views configured to your liking and walk through a single performance analysis technique – top-down analysis.
Top-down Performance Analysis
Once you have recorded and loaded a trace for analysis, there are a number of techniques to investigate performance. For this post, we’ll walk through a technique called top-down performance analysis, which is focused on finding the most obvious and impactful performance problems on a page – literally investigating operations from the top down by impact in milliseconds. This general technique can be used in many tools, including the JavaScript view in the F12 Developer Tools, as well as in WPA.
To perform this analysis, begin with in Windows Performance Analyzer’s “Frame Analysis” tab. Under CPU Usage, sort the collapsed nodes by decreasing total CPU time (weight in milliseconds). From here, review each node and look up the corresponding source code to evaluate the potential reduction in call counts until CPU time breaks into smaller pieces. Note that this step is easiest with unminified code.
On a complex page, you should apply this technique to each major component independently. Many site have several separate components competing for CPU and network time, which the top-down analysis technique will help to highlight.
Sample analysis
Using the top-down analysis technique, let’s walk through the analysis of the demo page which we recorded above. For the purposes of this example, we’ll use a performance issue that is relatively simple and contrived.
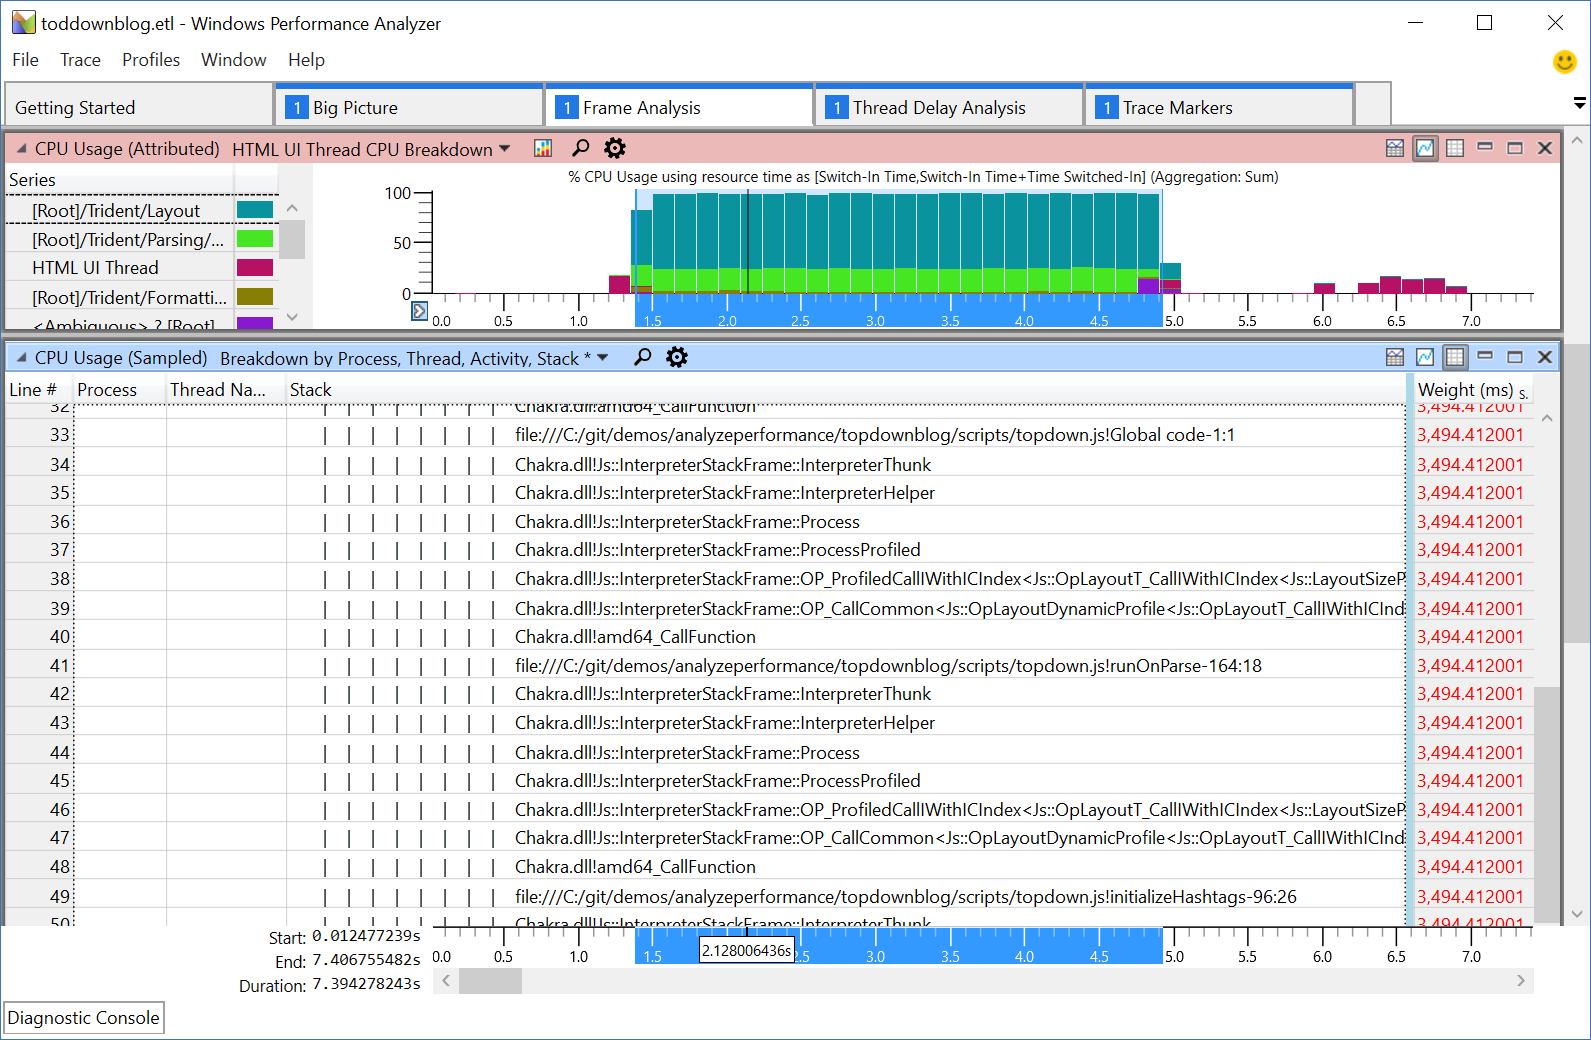
Follow the instructions above to open the recording and then open the trace of our sample page in Windows Performance Analyzer. After doing so, go to the Frame Analysis tab and scroll down to the CPU Usage (Attribute) graph. Highlight the portion of time that has a visible graph and right click to Zoom in. This will filter the information in the CPU Usage (Sampled) table down to only that section of time. Next, remove the Thread ID and Activity to get a bit more space to view the Stack.
We’ll begin our Top-down Analysis here by clicking in the UI Thread root in CPU Usage (Sampled) seen in the screenshot below. Expand the tree and review what is occurring until you find the first bit of JavaScript—this should be topdown.js!Global code-1:1 (line 1, column 1). This appears to call down into runOnParse-164:18 (line 164, column 18) which then calls into initalizeHashtags-96:26 (line 96, column 26).

If we look into the code referenced here, we can observe that Global declares a few consts, creates a number of functions and calls runOnParse. So far so good! Continuing down the stack, we’ll next look into runOnParse. This appears well structured:

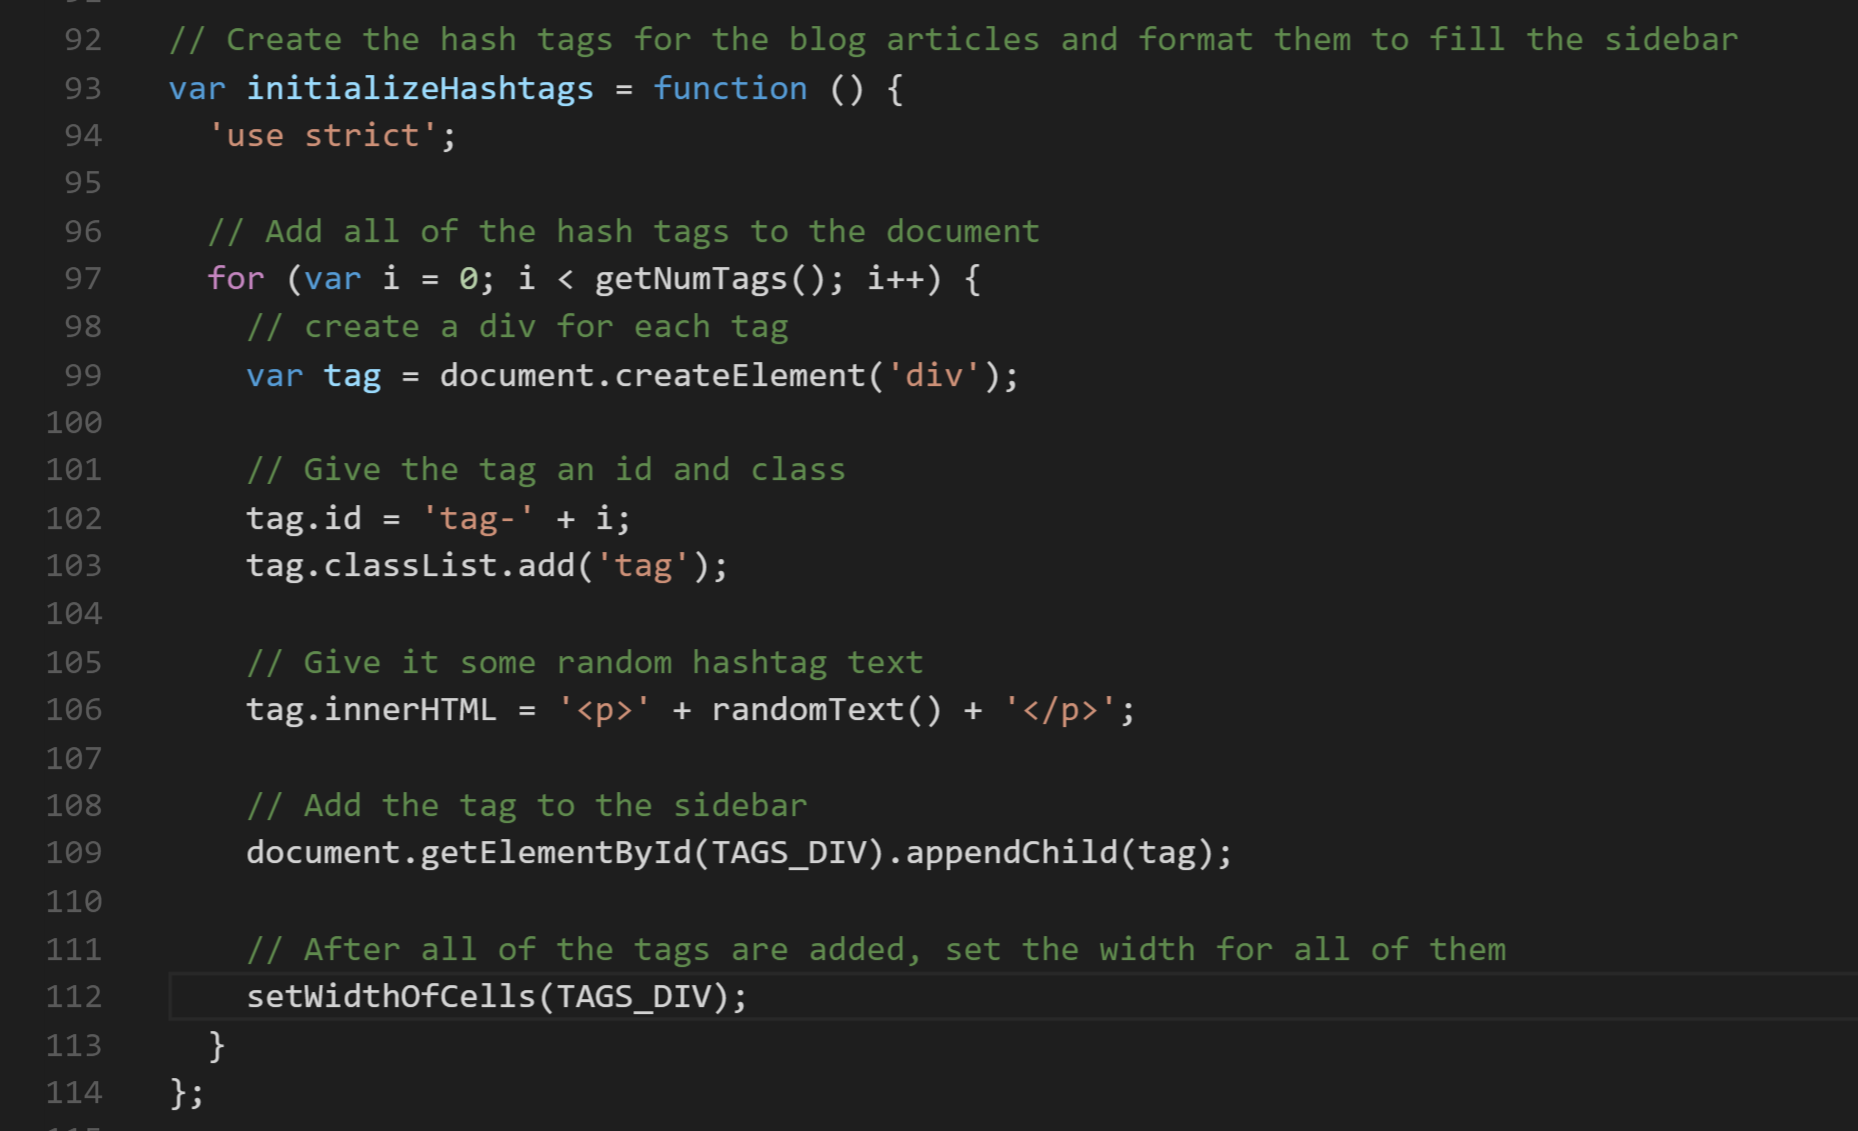
Next, we’ll look into intializeHashtags. Reviewing the code, we observe a loop that creates the hashtags. We also can observe a line at the end of the loop with a comment (lines 111-112) that it should run after the loop where all hashtags are created.

This is our problem code! Moving setWidthOfCells outside of the loop will run it after all hash tags are created, running only once instead of once for every tag, resulting in a dramatic performance improvement.
This is a relatively simple and contrived example, but illustrates the principle well. Top-down performance analysis is just one technique—while it’s a good start to debugging many simply performance problems, WPT enables more sophisticated approaches as well. Some other techniques include Bottom-up DOM API Analysis, which groups all of the API calls and then looks at the callers to find important optimizations, as well as Synchronous Layout Reduction. We plan to explore some of these techniques in more detail in future posts and demos.
Try out the Windows Performance Toolkit for yourself!
The best way to get acquainted with WPT is to try it out for yourself! We’ve published the slow web page used in the above example to our demo site and GitHub so you can follow along to identify the performance problem – see my video from Edge Web Summit to follow this debugging in real time.
WPT is powerful but it can be a steep learning curve – if you have any questions, don’t hesitate to reach out! You can get in touch via the comments below or @MSEdgeDev on Twitter with any questions or comments.
– Todd Reifsteck, Senior Program Manager, Microsoft Edge
