It is said that “A point of view is worth 80 IQ points”; the meaning perhaps being that if we can look at things in different ways then we might understand them better. The Memory Profiler that ships with the Windows Phone SDK 7.1 provides, in its own way, multiple views into the memory usage of your application, and in an earlier post we had seen how specific views helped us understand one particular issue with the application better. But even before we got to the specific views, there was a graph and a couple of rows of markers, remember? Let us discuss them briefly.
Launching the Memory Profiler
How do you even know that you need to run your application scenario through the Memory Profiler, especially since there might not be any obvious visual cue? The answer lies in an Execution Profiler warning message. The expectation is that you would run your application scenario through the Execution Profiler for evaluating visual and code performance, and if it suspects any memory related issues it will raise a warning message suggesting running the scenario through the Memory Profiler!
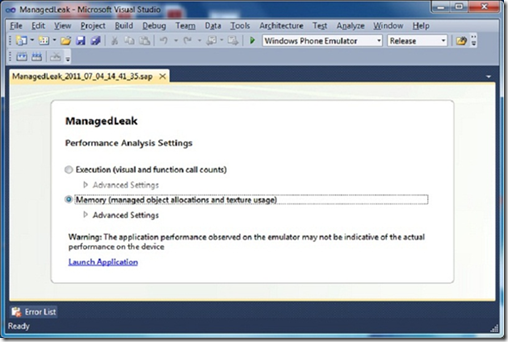
Users of the Execution Profiler will find the interaction model of the Memory Profiler familiar. It launches from the same page, with the difference being that you select the Memory (managed object allocations and texture usage) option. The Advanced Settings option can be ignored for the purpose of this discussion. The following is the launch page for the Memory Profiler:
A warning message is issued if the deployment target happens to be the Windows Phone Emulator. The emulator runs on the desktop, and the desktop has a different hardware architecture than the device, with different performance characteristics across the board. The warning therefore alerts you to this lack of performance fidelity. If you are doing Execution profiling beware! The emulator is still a suitable target for doing memory profiling since in that case we are dealing with (memory) allocation profiling. Clicking on the Launch Application link deploys the application to the target and commences the profiling session.
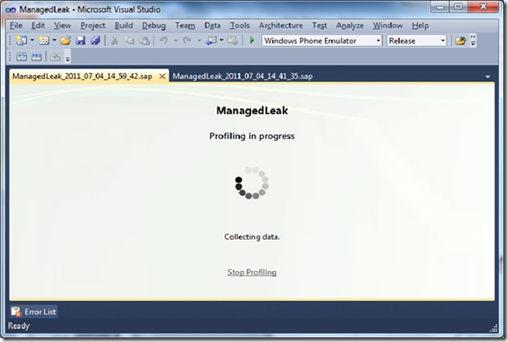
Stop Profiling
There are two ways to gracefully end the profiling session:
- By hitting the Stop Profiling link on the Profiler page.
- By hitting the back button on the target (device or emulator) until you exit the application.
If the connection from Visual Studio to the target is broken for any reason (for example, if the emulator instance is closed, or the device is untethered, or the device shuts down, the connection is broken) the session is aborted.
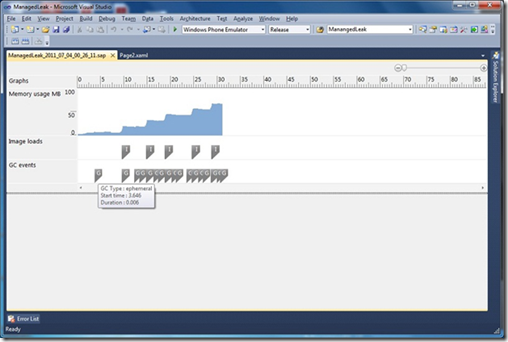
Once the session is gracefully ended, the data gathered during the run is processed and presented graphically for analyses, starting with a Memory Usage graph plotting memory usage over time, and two rows of markers indicating image loads and GC runs as shown below:
Memory usage graph
The memory usage reported is that of private bytes: exclusive bytes allocated by the process being profiled. Some variance in memory usage is normal and not indicative of a problem. However, memory usage that keeps rising bears examination.
Image load markers
A tooltip on the image load marker indicates the encoding format, the ID of the executing thread on which it got loaded, the point in time when it was loaded, and how long it took to load. A spike in memory usage corresponding to an image load marker might indicate a large sized image being loaded (larger than 2000 x 2000 pixels). Windows Phone imposes this limit, and larger images will be sampled at a lower resolution, and will take longer to load. If you must use large images consider displaying only a portion that meets this limit by loading the image into a System.Windows.Media.Imaging.WriteableBitmap and using the LoadJpeg(WriteableBitmap, Stream) extension method as shown below:
int width = (int) this.image1.Width;
int height = (int) this.image1.Height;
Uri uri = new System.Uri(“image.jpg”, UriKind.Relative);
StreamResourceInfo sri = Application.GetResourceStream(uri);
WriteableBitmap wb = new WriteableBitmap(width, height);
System.Windows.Media.Imaging.Extensions.LoadJpeg(wb, sri.Stream);
this.image1.Source = wb;
The ID of the executing thread can be used to check if the image load computation is happening on the UI thread (the UI thread’s ID can be got from the CPU Usage analysis from the earlier Execution Profiling session). To keep the UI responsive it is essential to keep the UI thread relatively free, and if you notice that the image load computation is indeed happening on the UI thread, consider moving it to a background thread using the BackgroundCreation option. From XAML, this can be done as shown below:
<Image Name=”image1″>
<Image.Source>
<BitmapImage UriSource=”image.jpg” CreateOptions=”BackgroundCreation”/>
</Image.Source>
</Image>
An exercise to try out at this point it to memory-profile an application that loads in a large image; do you see a spike in memory usage corresponding to the image load marker? What was the duration of the image load? On what thread was it getting loaded? Try using the BackgroundCreation option; now what was the thread on which the image got loaded? Did the duration of the image load change? Let us know your experience.
GC markers
Memory is a limited resource on the phone, and although you are programming in a managed environment where the GC takes care of collecting unused memory you still wield control over allocation and referencing, and must monitor them to trim working set. The GC mediates all allocation requests from your code, and operates on a heap that it has partitioned into 2 regions (generations), with allocations happen in the ephemeral “Gen0” region and objects surviving a GC collection possibly promoted to an older “Gen1” region. The GC markers correspond to collections and a tooltip indicates it’s kind (“ephemeral”, “Full”), the point in time when it started, and how long it took to run. An “ephemeral” GC collects only from Gen0 while a “Full” GC collects from both Gen0 and Gen1. Furthermore a “Full” GC can do a “compaction” of the heap if it happens to be significantly fragmented, and even go on to empty the system’s cache of JIT compiled code.
A GC is triggered using several heuristics:
- When the amount of managed memory allocated since the last GC is deemed significant (1 MB). This is typically an “ephemeral” GC. However it can turn into a “Full” GC under the following circumstances:
- When the managed memory held by objects promoted to Gen1 is deemed significant (5 MB).
- When the application’s total memory usage is deemed significant (i.e. close to the maximum allowed by the OS).
- When there is significant native-memory pressure – native-memory associated to managed objects (quite common in Silverlight) contributes to total memory usage!
- When user code calls System.GC.Collect(). This is always a “Full” GC.
- After any resource allocation failure. This is always a “Full” GC.
- When the system as whole is running low on free memory. This is always a “Full” GC (that will go all way to emptying the cache of JIT compiled code).
The GC’s decision of deeming a threshold “significant” is based on internal heuristics and mentioned here for informational purposes only. The point to note though is that a “Full” GC is much more performance intensive than an “ephemeral” GC.
Insight
Armed with the graph, the markers and your own intuition, you can now get some insight into your scenario’s appetite for memory:
- Does memory usage cross the 90 MB technical certification requirement threshold?
- Is memory usage steadily growing?
- Do you see a spike in memory usage? Is there a corresponding image load marker? That could be the likely cause (are you using large sized images when a smaller sized image would do?)
- Are image loads taking long? (Again, this could be due to using large images).
- Are image loads happening on the UI thread (consider moving that to a background thread).
- Are there too many GCs? The GC on the Phone is a stop-the-world GC, and therefore the time taken by the GC to run is time taken away from your application! In general strive for little to no GC activity during application startup.
- The frequency distribution of the GC markers indicates the rate of memory allocation in the scenario, as well as the time ranges when most GC activity happened. If you are writing a game try to concentrate the GC activity during a level change.
- Are there multiple adjacent “ephemeral” GCs? That indicates short lived and/or temporary objects.
- Is memory usage not coming down even after one or more “Full” GCs? That is indicative of long lived objects.
- Are you explicitly causing “Full” GCs by calling System.GC.Collect()? That is rarely required, and often a bad idea.
An exercise to try out at this point it to profile an application that has various memory allocations patterns; can you correlate the graph and markers with your own intuition? Let us know your experience.
Summary
The graph and markers provide basic information about your application’s memory usage and when combined with your own intuition of the application scenario, be used to infer several characteristics. Further drill down through the various Views can then be used to understand these characteristics better.
Would you like to know more about the Views? Let us know.


