In an earlier post we looked at how we can gain broad insight into an application scenario’s memory characteristics and how the graph and markers drew our attention to ranges of execution for further analyses. Recall that in the memory leak diagnosis case we chose to analyze only the time range over which we observed the increase in memory usage. Indeed, that is a key first step to the analysis: filtering the memory activity data by a time range. The Heap Summary view is the result of such filtering, and represents the population of the heap during the chosen time range.
Heap Summary View
The Heap Summary view presents, in tabular form, a demographic analysis of the population of the heap.
In human population demographics, data collection happens through a census as well as through a continuous update to registries that track births, deaths, migration of place of residence and the like. The data collection in the case of heap population demographics is no different. “Births” map to allocations, “deaths” map to objects’ memory collected by the GC, and “migration of place of residence” maps to the migration of objects between the Gen0 region of the heap and the Gen1 region. A census of the heap at the start of time range identifies all incumbent objects (i.e. that were in existence). Births, deaths, and migrations are updated continuously, and a final census at the end of the time range identifies all the objects that were retained. In order to have a consistent terminology, we refer to the incumbent objects at the start as objects that were “retained” at the start.
Managed Silverlight Visual elements (i.e. objects that go into the Silverlight visual tree) are not just plain old managed objects. These might be facades with backing native-implementations holding native memory and during the course of execution might create and hold on to texture memory. Casual use of such elements in code can even lead to subtle leaks. From this perspective, subsequent analysis can be made easier if Silverlight Visual elements were tracked and reported separately from plain old managed objects. And this is precisely how they are tracked and reported through the Heap Summary view. Continuing with the demographic analogy, such classification has precedent in social demographics where human populations have been classified on ethnicity.
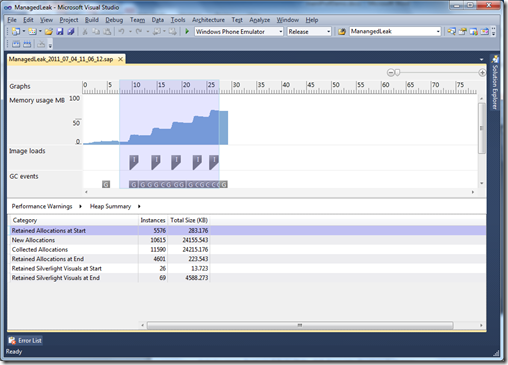
Armed with this context, let us study the following Heap Summary view from the memory leak diagnosis case:
The shaded region across the graph and markers indicates the time range used as the filer.
The census at the start reports 5576 instances of managed type objects accounting for about 283 KB and 26 instances of Silverlight Visual elements accounting for about 13 KB. In terms of incumbency the plain old managed objects dominate.
The churn happening within the selected time range is reported as 10615 instances allocated (births) and 11590 instances collected (deaths), accounting for about 23 MB each. The counts and sizes are somewhat balanced and cancel each other out to an extent. And this is borne out by the census at the end for the managed objects; the census at the end reports 4601 instances of managed type objects accounting for about 223 KB, which is just a little lower than what we had at the start. However, it also reports 69 instances of Silverlight Visual elements accounting for about 4 MB now (up from 13KB at the start).
When we correlate this table with the graph, our suspicion is drawn towards the Silverlight visuals. Why did their count go up, and why are they accounting for so much more memory? Within the filtered time range, memory usage has been steadily increasing too. Could we be leaking memory? Could we be leaking some part of visual tree itself? And there even seem to be images being loaded along the way; might we be leaking their texture memory too? We wonder.
Clearly, the next lead to follow is to get more visibility into what are those “Retained Silverlight Visuals at End”.
Summary
The Heap Summary view presents, in tabular form, a demographic analysis of the population of the heap. Interpreting the data in the table and correlating it with the graph and markers by itself can be used to make educated guesses at what could potentially be the problem, but equally importantly it serves to inform the next step in the performance investigation, as we shall see.

