[Performance is a key concern for all but the most trivial of apps, and memory usage helps determine how well your app runs. In this series, Pratap Lakshman shows how the Windows Phone Performance Analysis Tool can help you diagnose and fix memory issues and improve app performance. –ed.]
In previous installments I explained how the Heap Summary view of the Windows Phone Performance Analysis Tool provided a categorized demographic representation of heap activity, and that the Types view presented a convenient grouping of the participating types.
Today I’ll focus on the Instances view, which takes things a step further by presenting an account of the lifetime of every allocated instance of each of the participating types. Tracking the lifetime of each allocated instance on the heap calls for diligent bookkeeping from the profiler; each instance has to be uniquely identified and its progression through the object lifecycle accounted for.
A sample
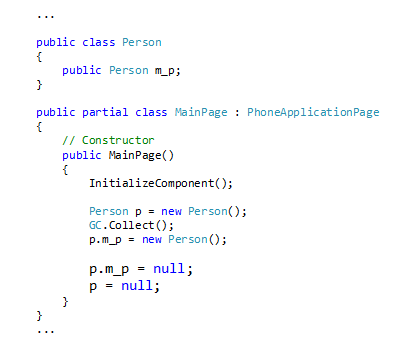
Consider the execution semantics of the following code snippet from this sample:
As discussed in an earlier post, the GC mediates all allocation requests from your code, and operates on a heap that it has partitioned into two regions (generations), with allocations happening in the ephemeral “Gen0” region and objects surviving a GC run possibly promoted to an older “Gen1” region. The new instance of Person is thus allocated in the Gen0 region.
Thereafter, we explicitly induce a full GC run with a call to GC.Collect. It is seldom a good idea to call GC.Collect directly, but in this case we do so in order to keep the example brief and focus attention on how object instances might migrate between generations and illustrate how the profiler is able to track and report that; the alternative of allocating thousands of objects until the GC was provoked could as well have been used. In the present case, the GC cannot reclaim the memory allocated to the Person instance because that is still referenced by ‘p’; the instance survives the run and as an implementation detail is migrated to (promoted) the “Gen1” region.
We then allocate another instance of a Person. Remembering that all new allocations happen in Gen0, we now have a case where an instance in Gen1 (‘p’) is referencing an instance in Gen0 (p.m_p).
Finally, we explicitly set both p.m_p and p to null; since their memory is thus no longer referenced, it can be garbage collected. However, since there are no further induced GCs in code, and no further memory allocation pressure to provoke a GC during the rest of the course of the application’s execution, the next GC will be run only at the time the application exits (in the context of the AppDomain getting unloaded). The memory for these instances remains uncollected until such time.
To see how the profiler reports the above semantics, launch the sample through the Memory Profiler (as in the previous post, you can leave the Allocation Depth set to 12).
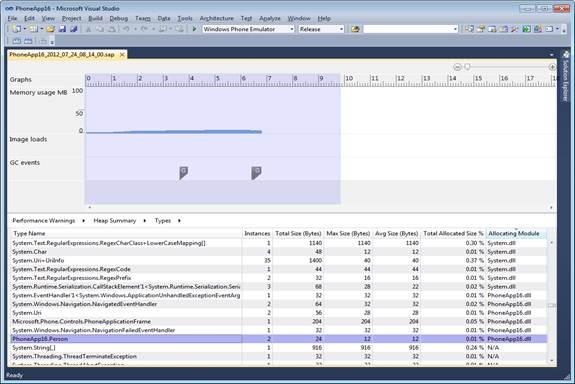
Navigating to the Types view via the New Allocations category shows the following table:
As expected there are 2 allocated instances of Person.
The Instances view
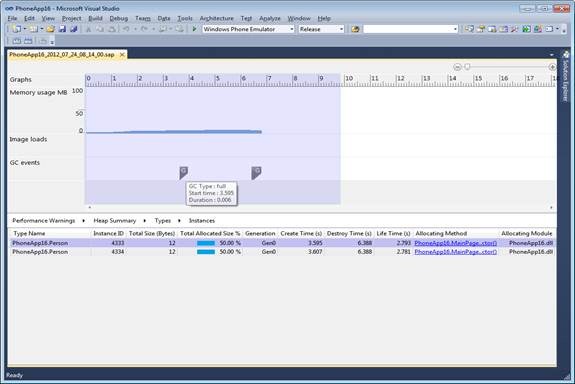
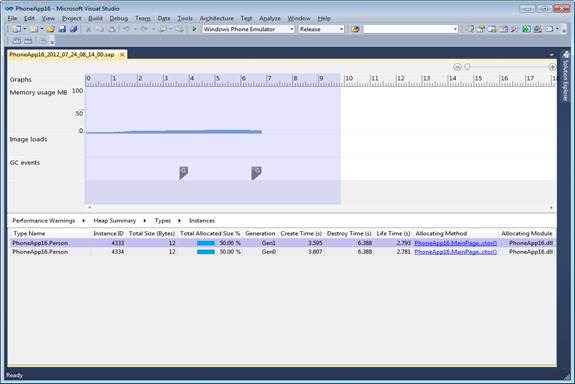
Navigating to the Instances view from here shows the following table:
Notice the following:
- 2 instances of Person identified by unique IDs; 4333, 4334.
- The instances can be dated based on their Create Time timestamp: 4333 (elder), 4334 (younger).
- There was a Full GC run in between the allocations of the two instances as seen from the timestamp on the tooltip over the GC marker and the time stamps of Create Time of the instances.
- Both of the instances were allocated in the Gen0 region.
- And the provenances as discussed as we had seen the in Types view.
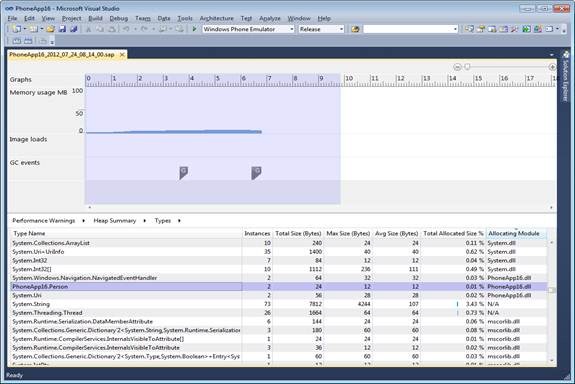
Navigating to the Types view via the Collected Allocations category shows the following table:
As expected there are 2 collected instances of Person. Navigating to the Instances view from here shows the following table:
Notice the following:
- The same instances are now reported as collected (refer the same unique IDs).
- The older instance resides in “Gen1”, whereas the younger instances resides in “Gen0”.
- Both instances remain alive almost throughout and are collected at 6.003s (“Destroy Time”) into the execution of the application. There is no prescribed immediacy associated with when an object becomes dead and when it will be collected by the GC. While our sample was intentionally simple consider the case where an object becomes dead, but there is no subsequent GC during the rest of the application’s execution because the application was able to maintain its allocation rate below the threshold that would have triggered a GC. In such a case, the dead object is not collected until the GC eventually runs. Games might routinely control their allocation rate during game play to be below this threshold to avoid triggering a GC.
- Looking at the GC markers we see that this Destroy Time corresponds to that eventual full GC (that was run at the time the AppDomain itself is unloaded).
- The older instance had a marginally longer lifetime than the younger instance.
- And the provenances as we had seen the in Types view.
Together, these map exactly with the interpretation and associated commentary of the source code above! In an upcoming post, I shall introduce the Methods view and how it enables tracing the execution path leading up to each allocation.
This series shows you how to take advantage of the memory profiling feature of the Windows Phone Performance Analysis Tool. More posts in the series:

