[Performance is a key concern for all but the most trivial of apps, and memory usage helps determine how well your app runs. In this series, Pratap Lakshman shows how the Windows Phone Performance Analysis Tool can help you diagnose and fix memory issues and improve app performance. –ed.]
In previous installments I explained the tool’s Heap Summary, Types and Instances views. Today I’ll focus on the Methods view, which enables tracing the execution path leading up to the allocation of an instance.
Fixing a memory usage issue ultimately requires going to the method in source that caused the allocation, but as we saw previously allocation requests can be camouflaged in syntactic sugar or compiler generated type names, and the process of discovering the source of an allocation and the execution path that led to it can get wearing, a condition the Methods view alleviates.
A Sample
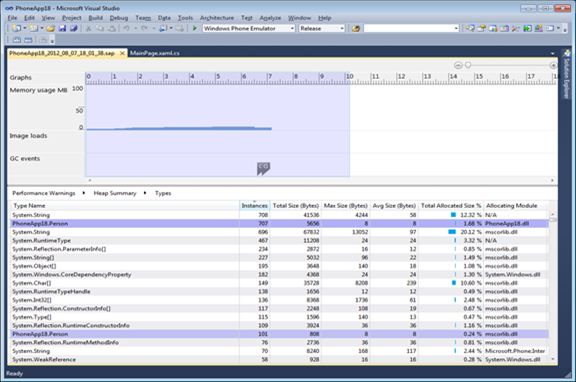
Consider the allocations from this sample in which instances of a Person are allocated from various methods. Launch the sample through the Memory Profiler (as in the previous example, you can leave the Allocation Depth set to 12). Navigating to the Types view via the New Allocations category shows the following table:
Notice that there are 707 instances allocated from the PhoneApp18.dll module, and an additional 101 instances allocated from mscorlib.dll. From here on, the Instances view can reveal details per-instance, all the way to the module and method causing the allocation. The Methods view on the other hand, can reveal not only the methods that caused the allocations, but also the execution path leading up to the allocation – the ‘allocation stack’.
The Methods View
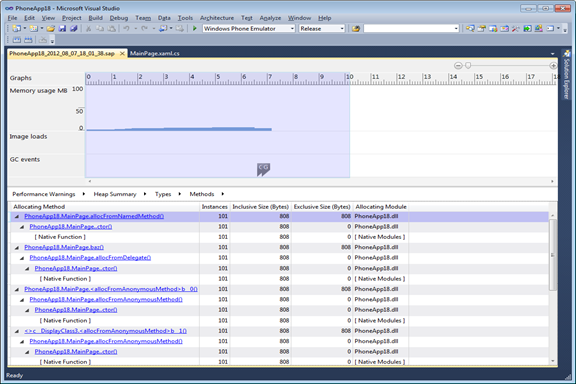
Here is the Methods view for the 707 allocations:
Methods along the allocation stack are reported with the module to which they belong, as well as any allocations they might have done exclusively. In the present case, we notice that 101 of these allocations happened exclusively from PhoneApp18.MainPage.allocFromNamedMethod() which was called from the constructor of Mainpage which did not do any allocations of its own (is shows an Exclusive Size of 0 and there is no corresponding increase in the Inclusive Size). Both of these, being in application code, are hyperlinked for direct navigation to source. The stack frames further down the stack are from native code and, being non-actionable by the developer, elided.
Delegates and Extension methods
Similarly, notice that another 101 of the allocations happened from the method baz via a delegate invocation in allocFromDelegate method, and the 101 allocations happening from the extension method on the String class are reported as shown below.
Property accessors
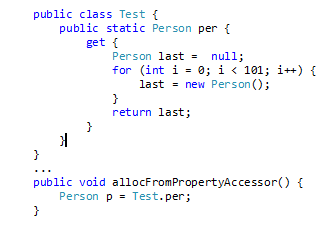
Consider the following code snippet where allocations happened from a property accessor:
The compiler synthesizes a getter accessor method for the property “per” using the convention get_per and emits appropriate metadata that binds this method as property named “per”. Reading of the “per” property is then replaced by a call to the synthesized accessor method. This is reported as follows:
101 of the allocation happened exclusively from the get_per accessor method, and since the property is in application code, it is hyperlinked for navigation to source. Clicking on the hyperlink takes you to the first line in source of the getter accessor.
Anonymous methods
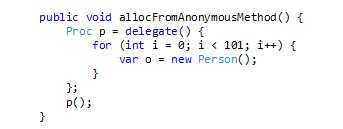
Consider the following snippet where allocations happened from an anonymous method:
Understanding how this is reported calls for a brief digression into code generation techniques for anonymous methods. Anonymous methods can be of two kinds – the first “simple” kind does not use any local variables from its lexically-enclosing method; the anonymous method could as well have been its own separate member function. As part of code generation the compiler simply converts it into a uniquely named method on the class, and uses that name in place of the “delegate (…) { … }”. Once so compiled the methods are anonymous no more. This is reported as follows:
<allocFromAnonymousMethod>b_0 is the synthesized method name and it is suitably mangled so that it cannot be used as-is even accidentally from source code. 101 of the allocation happened exclusively from this method, and since it was added to application code, it is hyperlinked for navigation to source and clicking on the hyperlink takes you to the first line in source of the anonymous method.
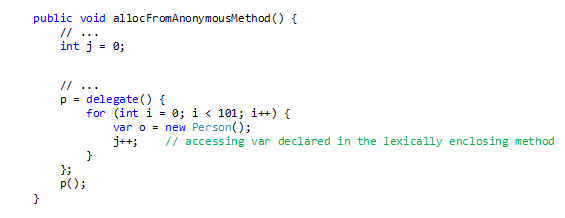
But what about the following snippet where allocations happened from another similar anonymous method:
This is the “complex” kind of anonymous method. The body of an anonymous method is permitted to access the local variables of its lexically-enclosing method, in which case the compiler needs to keep those variables alive so that the body of the anonymous method can access them. Faced with this kind of an anonymous method, wherein variables are shared with the lexically-enclosing method, the compiler generates a helper class. The helper class contains the local variables that are shared between the enclosing method (allocFromAnonymousMethod) and the anonymous method (in this case, just the variable ‘j’). In allocFromAnonymousMethod, access to that shared variable is done through this helper class, and the anonymous method is generated as a uniquely named method on this helper class. As before, the generated names as mangled, and the compiler uses the full name of the generated method in place of the “delegate (…) { … }”. This is reported as follows:
<>c_DisplayClass3 is the synthesized helper class, and <allocFromAnonymousMethod>b_1 is the synthesized method name. 101 of the allocation happened exclusively from this method, and since it was added to application code, it is hyperlinked for navigation to source and clicking on the hyperlink takes you to the first line in source of the anonymous method.
Lambda expressions
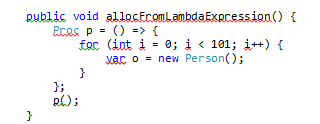
Lambda expressions are handled somewhat similarly to anonymous methods. In the following snippet, allocations are happening from within a lambda expression.
This particular expression is similar to the “simple” kind of anonymous method. As part of code generation the compiler simply converts it into a uniquely named method on the class, and uses that name in place of the “() => { … }”. It is reported as follows:
<allocFromLambdaExpression>b_5 is the synthesized method name, 101 of the allocations happened exclusively from this method, and since it was added to application code, it is hyperlinked for navigation to source and clicking on the hyperlink takes you to the first line in source of the lambda expression.
Generic methods
Allocations happening from within generic methods are reported similarly but with a few differences. Consider this snippet: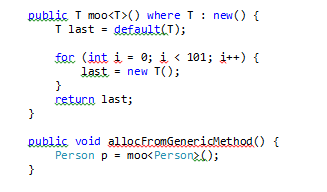
Recall that the Types view reported as 101 instances of Person getting allocated from mscorlib.dll? Navigating to the Methods view therefrom shows the following.
Notice that the call moo<Person>() causes the generation of a concrete instance of the type parameter (in this case Person) and invoke its constructor through reflection. For such cases the allocations are associated with the constructor invocation through reflection, and the allocating module is recorded as mscorlib.dll.
Navigating to the Instances view
Finally, navigating to the Instances view from the Methods view reveals the individual instances allocated from with the method! One can navigate directly to the Instances view from the Types view: to query all of the instances and their provenance for a selected type – or alternatively navigate directly to the Methods view first and therefrom to the Instances view: to query all of the instances sharing the same provenance. For example navigating to the Instances view for all the allocations happening from the property accessor shows this, by now familiar, tabular report:
In summary, the Methods view pinpoints the source of each explicit managed allocation and reports the execution stack that led to the allocation – the allocation stack. Equally importantly, the drill down navigation paths from Types to Instances, and from Types to Methods and therefrom to Instances, serve as the means to both index and reverse-index every such allocation.
In subsequent posts we will look at how in-memory connectivity between instances is reported. Such reports can be used to see the object graphs in use and reason about object lifetimes in the context of the garbage collected runtime.
This series shows you how to take advantage of the memory profiling feature of the Windows Phone Performance Analysis Tool. Related posts:
· Part 1: Memory Profiling for Application Performance
· Part 2: Memory Profiling: Launching, Graphs and Markers
· Part 3: Memory Profiling: The Heap Summary view
· Part 4: Memory Profiling: The Types View
· Part 5: Memory Profiling: The Instances View

