This blog post was authored by Mini Nair, a program manager on the Visual Studio team.
– Jonathan
Mobile phone users expect the apps running on their phones to perform well at all times and be of super quality. A slow startup or a jerky UI is an absolute no. If playing a game or watching a video completely drains the phone’s battery, users will be very cautious about using that game or app again! Similarly, if they receive hefty bills due to continuous network data consumption by the phone’s apps, the resulting “bill shock” might lead them to use these apps less or not to use them at all. There are many more scenarios like these that lead to user dissatisfaction and reduced interest in a mobile app.
As a mobile app developer, it’s important that you make your app stand out among the thousands of apps in the Windows Phone Store. Your app may be very different from others, but if it doesn’t take into account even one or two of the kinds of issues mentioned above, it’s likely to take a plunge in the popularity rating.
To help ensure that your app meets users’ expectations, there’s a new tool you should become familiar with in the Windows Phone SDK 8.0 – Application Monitoring. The key purpose of the Application Monitoring tool is to provide a mechanism for you to identify performance bottlenecks in your app during development. Aided with this information, you can monitor the quality of your app with respect to various parameters, like startup time, memory consumption, and other variables that affect end users.
If you’ve already used the Windows Phone Performance Analysis Tool that was released as part of the Windows Phone SDK 7.1, you can think of the new Windows Phone Application Analysistool as an extension to it. This new tool provides information like what you’d get from the profiler tool, but it categorizes the information for you and presents it in a summarized format that makes it easy to analyze.
Application monitoring
To help you understand the Application Monitoring tool and how to use the data it provides, we’ll refer to a sample Flickr app where you’ll do the following:
- Select a photo album from a preset Flickr account.
- Browse the photos in a scrollable wrap panel.
- Tap a photo to go to the slideshow.
- Browse the photos in the slideshow mode or play the slideshow with custom speeds.
- Tap a photo to add picture effects to it, such as a sepia effect or fisheye effect.
Before you can use the Flickr APIs, you must register with Flickr and get a personal API key. When you have the API key, you can call Flickr APIs from your app and create your own Flickr client. See herefor details about developing with Flickr’s APIs.
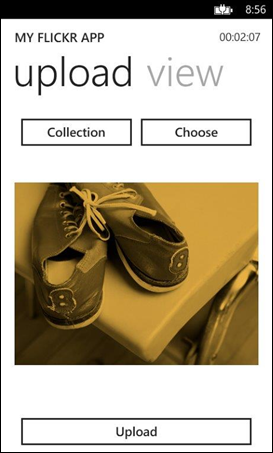
We’ll use a version of the PhotoSlydr app to demonstrate. The first screen of the sample app gives you the option to select the album and explore the photos in the album.
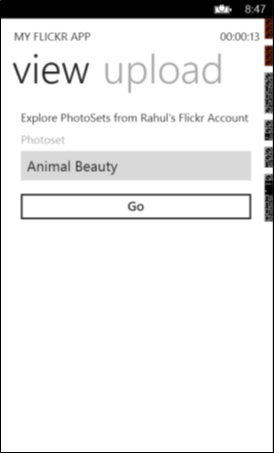 |
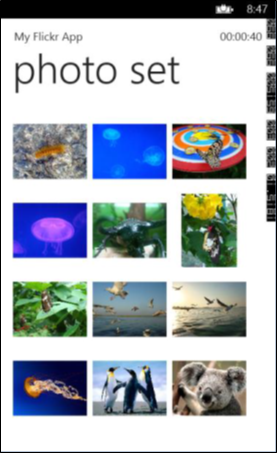 |
In addition, the app enables you to apply various picture effects to the chosen photo from the collection. By tapping the image, you can apply effects to it.
Now that you understand what the app does, let’s get started with monitoring the app.
To start Application Monitoring:
- In Visual Studio, select Start Windows Phone Application Analysis from the Debug menu, or press Alt+F1.
The Application Analysis window is displayed. - From the Application Analysis window, choose App Analysis under the Monitoring section and click Start Session.
The app will start on the chosen target (emulator or device), and the Application Monitoring tool will gather performance data in the background while you use the application on the emulator/device. - Click End Session to exit the app. The monitoring session will end, and a summary report will be generated.
Summary Report
The summary report is the first page you see when the application analysis is finished. It presents a high-level view of the application’s performance measured against a set of end-user–centric parameters.
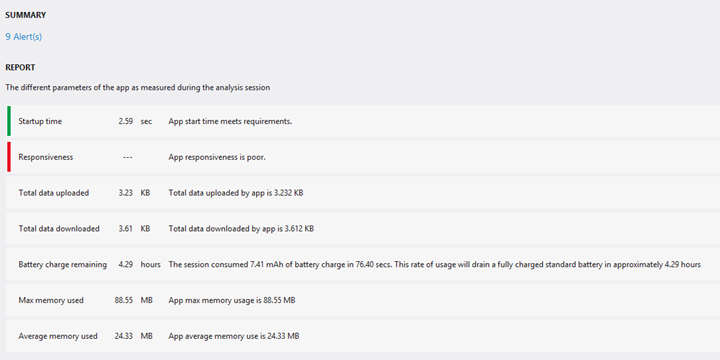
Here’s an example of a summary report:
This summary report shows that the app is doing well on startup time but is not responsive throughout the analysis session. The parameters that aren’t marked with either green or red (total data uploaded, total data downloaded, battery charge remaining, max memory used, and average memory used) are performance indicators and cannot be directly judged.
Here are the parameters shown in the summary report:
- Startup time:This parameter indicates the app start time from the point the app is launched to the point the first screen of the app (not the splash screen) is seen. If the startup time is less than 5 seconds, it’s all good and green. But if it goes over 5 seconds, the marker turns red.
- Resume time: (This parameter is not present in the report shown here). This parameter indicates the maximum time taken by the app to resume. There could be multiple cases where the app resumes; this value indicates the maximum resume case.
- Responsiveness:This parameter indicates the UI responsiveness of the app. If the app has problems with low frames per second (FPS), slow page loads, or UI stutter, the marker turns red.
- Total data uploaded and total data downloaded:These parameters indicate the data uploaded and downloaded by the app during the app analysis session.
- Battery charge remaining:This parameter provides an estimate of how long the phone battery will last based on the charge consumed during the app analysis session.
- Max memory used and average memory used: These parameters indicate the maximum memory consumed and the average memory consumed by the app during the app analysis session.
In the report shown here, we see that Responsiveness is red. We want to diagnose the Responsiveness issue. To do this, we click the 9 Alert(s) link, which brings up the All Alertsview.
All Alerts View
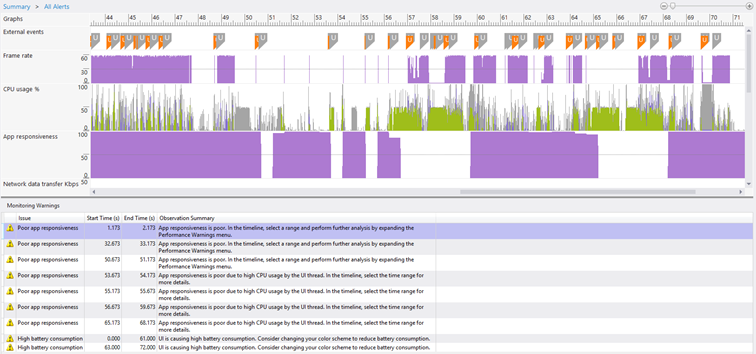
As you can see, the All Alertsview shows graphs and a warnings list.
Here’s what each graph means:
- External events:This marker graph shows two set of markers:
- The first marker type is ‘U’ – these indicate the actions users perform on the app. The orange markers show the gesture events like tap, flick, pan, etc. The gray ones show the raw inputs on the app. So if your app uses both gestures and raw inputs, it will show both marker types on the graph lane. Hovering over these markers will show additional details about the marker.
- The second marker type is ‘N’ – these indicate the network simulations you make while the application monitoring session is in progress by using the new Simulation Dashboard Tool in the Windows Phone SDK 8.0.
- Frame rate:Indicates the rate of rendering the frames in seconds.
- CPU usage %:Indicates the processor use by various threads.
- App responsiveness: Indicates the responsiveness of the app’s UI to the input given. This gives insights into how slowly or quickly the app reacts to an input given to it.
- Network data transfer: Indicates graphically the data uploaded and downloaded by the app.
- Battery consumption:Indicates the how much charge is consumed by display, CPU, and network individually.
- Memory usage: Indicates the amount of phone memory allocated over the time.
For detailed info on the network graph and issues, see the blog post Network Monitoring for Windows Phone Apps.
For detailed info on the battery consumption graph and issues, see the blog post Optimizing Battery Consumption of Windows Phone Applications.
One of the warnings in the Alertsview shown here is ‘App responsiveness is poor due to high CPU usage by the UI thread’.
We know that if the UI thread is busy and blocked, the app is going to be slow to respond to inputs. The warning also asks us to select the time range mentioned in the Start Time and End Time column to investigate.
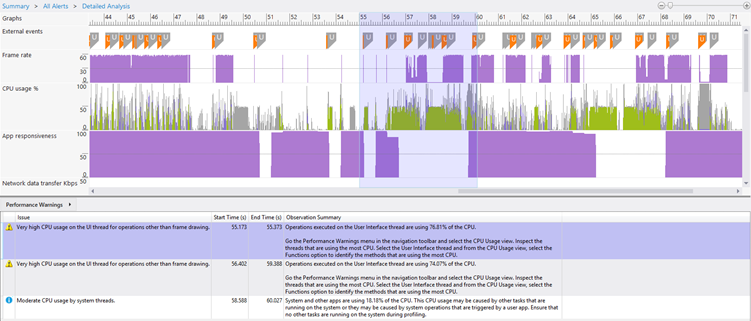
Let’s go ahead and select the time range between 55 sec and 60 sec. We are then greeted with the Detailed Analysisview.
Detailed Analysis
The Detailed Analysis view is similar to the All Alertsview, but it gives us more data to examine as we look for the cause of the responsiveness problem.
The first warning has the following observation summary.
Let’s begin by selecting the arrow next to the “Performance Warnings” option in the navigation bar.
We select CPU usage, then Functionsfrom the breadcrumb options, and we get the following screen.
The blue hyperlinked function is the user code function, and it’s taking a lot of time to execute.
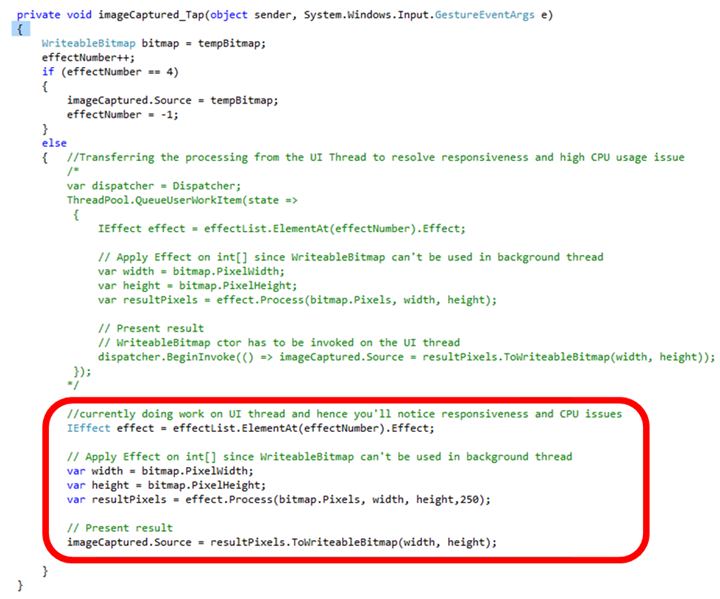
Clicking this link takes you to the source code in the app:
As you can see, the app is doing some heavy image-processing work in the UI thread, which is why we’re seeing the high CPU usage and the responsiveness problem.
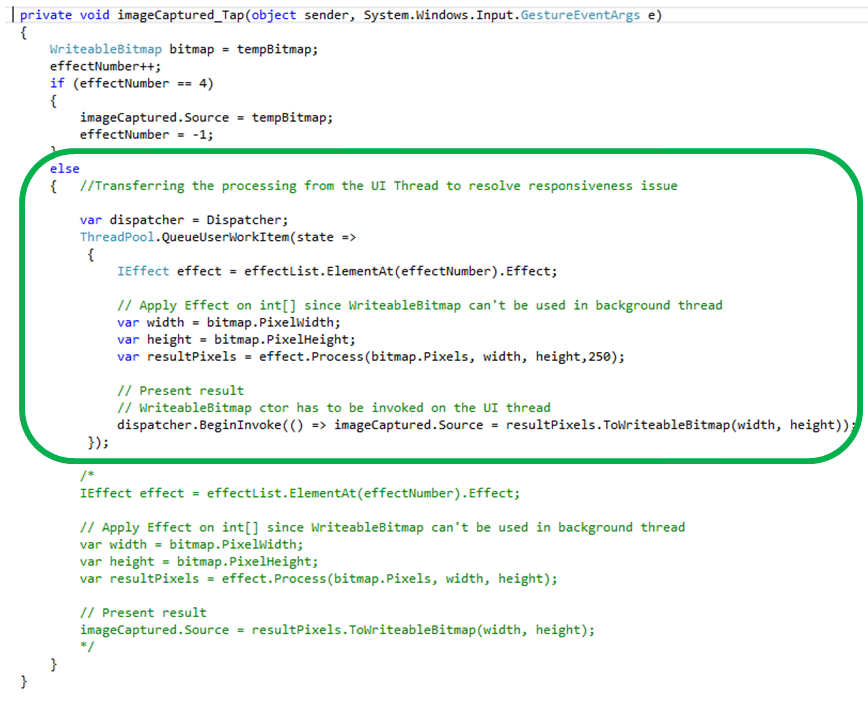
Let’s fix this code. To do this, we’ll move the work from the UI thread to a background thread. Once the work is complete, we’ll dispatch the updates to the UI thread to update the UI. The code looks like this:
Now let’s run Application Monitoring again and perform the same actions on the app as before.
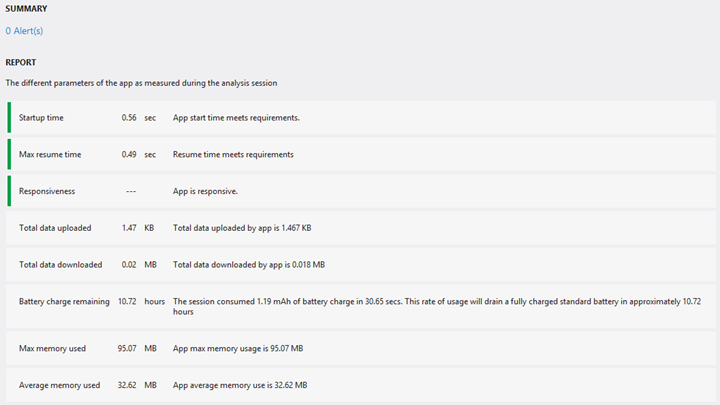
We get the following summary report:
Voila! No responsiveness problem. Green and good to go.
Next, we run Application Monitoring for the other scenarios in the app. If any problems are found, the tool gives us data for investigation.
The Application Monitoring tool helps you to identify performance issues in your app and fix them for optimal performance.
Resource Links:
App Monitoring for Windows Phone
How to: Capture and Analyze Performance Data Using Windows Phone Performance Analysis
How to: Identify and Fix Common Performance Issues Using Windows Phone Performance Analysis

