In the new unified Dev Center dashboard you now have access to more detailed information about app crashes to help you analyze bugs, delivered faster than before (often in a matter of hours).
This blog describes:
- the more comprehensive and timely crash information available in the unified Dev Center
- the new reports now available
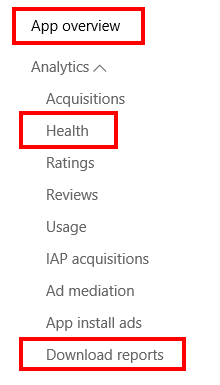
The unified Dev Center dashboard shows all crash data for Windows as well as Windows Phone apps in a single place, simplifying debugging of cross-platform apps. These crash reports can be found in the app overview, in the Health section of the analytics menu and in the Download reports option for each app:
Dev Center shows more comprehensive and timely crash information
When an app crashes, the event is logged in the operating system, and the device sends the event to the Windows Store central crash reporting system. To minimize network and CPU impact, only core crash metadata is sent (which include OS, app version and the function that failed). Based on the categorization of each event, the crash system determines if it needs to collect more information about the crash, and when appropriate, signals the OS in the originating device to collect heap file/crash dump next time the failure pattern occurs and send the .cab file.
This mechanism minimizes overhead in the device and user network, and enables the crash system to collect sample .cab files for the various types of failures for each app.
Previously, only crashes that had a .cab file associated were shown. This is what delayed the availability of crash reports, restricting the number of failures shown. The unified Dev Center presents the data as soon as it is available, even though it might not have a .cab yet (or ever). The failure log report does indicate the percentage of events that had a .cab collected for them.
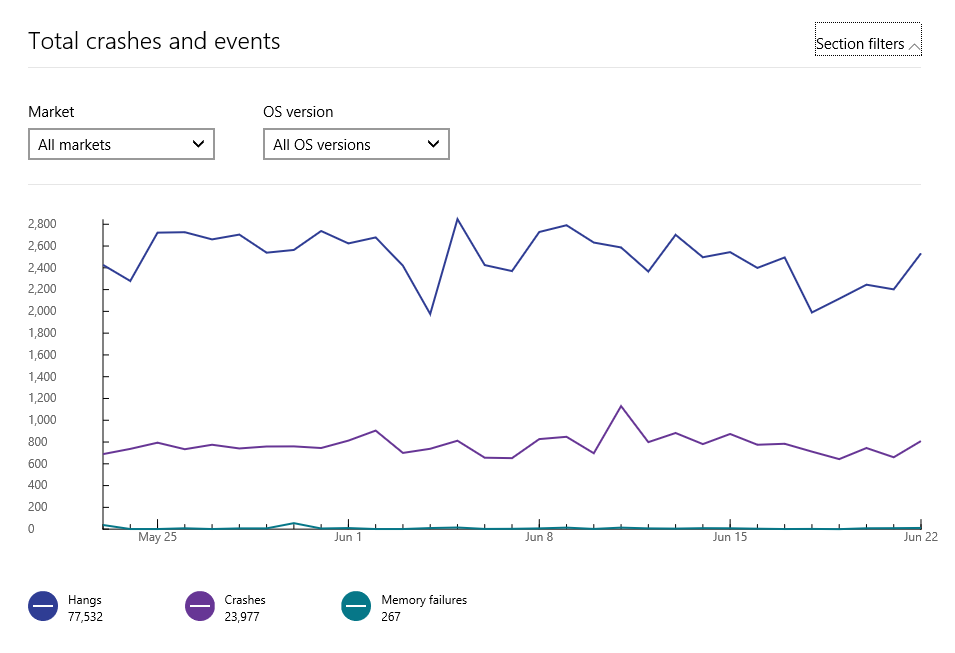
In addition to this change, the new user interface shows three types of events: hangs, crashes, JavaScript exceptions and memory failures.
With the addition of these failure events, the unified Dev Center provides more comprehensive and timely information about your application failures, as seen in the Total crashes and events chart:
Note that the .cab files currently available in Dev Center are no longer included in the unified Dev Center, instead this functionality is offered in the new Failure Logs in the App Health page and matches the information that used to be accessible through .cab files. Please share your feedback with us in this blog, and let us know if there are scenarios where .cab files provide information not covered with the new crash capabilities in Dev Center.
New reports available
The unified Dev Center also now includes five views of crashes that were not available before:
- Total crashes and events (shown above)
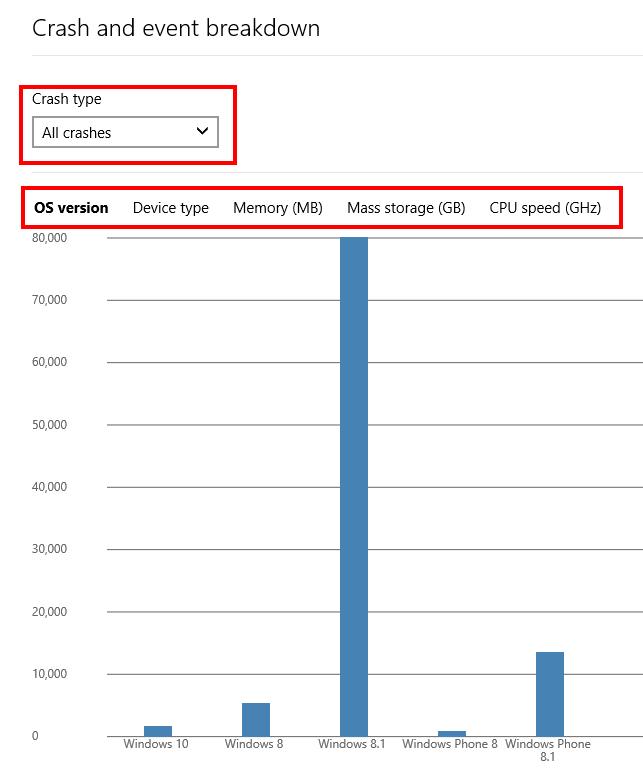
- Crash event breakdown (shown below) –shows hangs, crashes, JavaScript exceptions and/or memory failures by OS version, device type, memory, storage or CPU speed
- Failure by market – shows the failures by market
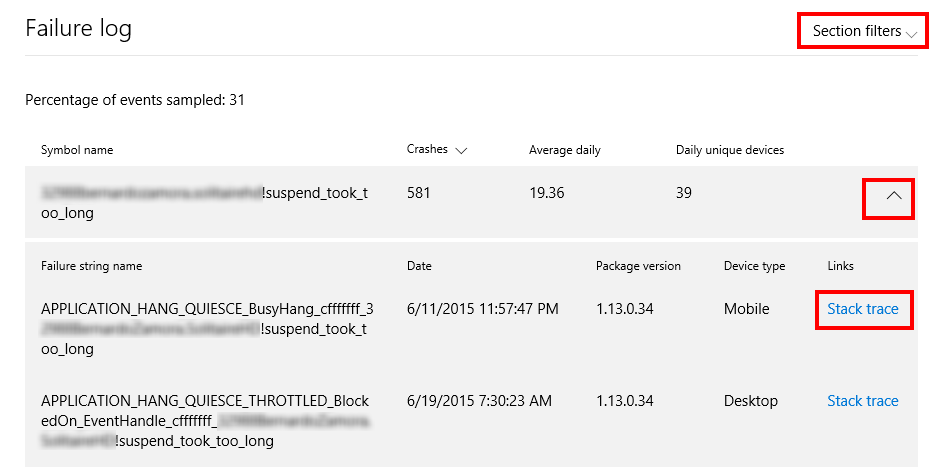
- Failure log (shown below) – shows the logs that include a .cab file, and displays the stack trace directly in Dev Center, without the need of a .cab file. The percentage of events sampled, displayed above the failure log, indicates the percentage of events that had a .cab collected. Crashes reported by Windows 8.x and Windows Phone have less information than Windows 10 crashes, so reports show the OS version as ‘unknown.’
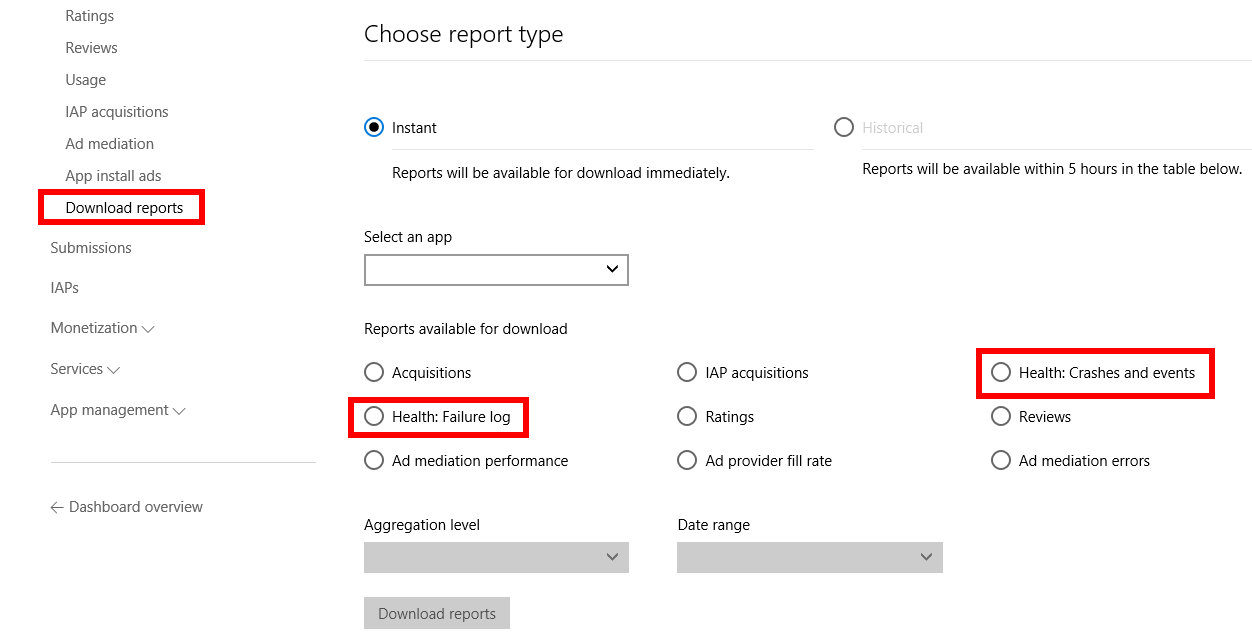
- Data Export (shown below) – two reports available to analyze logs:
- Health: crashes and events: counts how many events happened of each type of failure
- Health: failure log: provides the details for the distinct types of failure, as well as the stack traces
Debugging your apps
Dev Center now provides more tools to help debug and optimize your apps across all platforms. One recommendation to get started with debugging in the new Dev Center is to go to your app, then open Analytics, then Health:
- Filter the page by Package Version (in the top of the page), to find the latest crashes
- Filter the trend graph by OS version and market to narrow down issues
- Review the breakout charts to determine if the issue corresponds to a particular OS version or device characteristics
- Once you have narrowed the issue to a particular version of the app, OS or device, go to the Failure Log to view stack traces and diagnose the possible source of the issue
You can also do the same using the two export reports: crashes and failure log.
We continue to evolve the crash report data, so please use the new unified Dev Center, examine your crash information, and let us know if you find any issues. We also want to know what additional information you would find useful in debugging your apps.

