In the first post in this series, we talked about using the Windows Bridge for iOS to create Universal Windows Platform (UWP) apps that can run on Windows 10 devices using existing Objective-C code. Our third post explores using the iOS bridge to bring Storyboards and Auto Layout to Windows 10. This post will focus on getting Xcode and iOS developers familiar with the Visual Studio IDE, whether starting from scratch or using existing code from a source repository, such as GitHub.
Modern IDEs, especially those for app development, are becoming very similar. While each may have its own nuances and intricate IDE features, they will all generally offer the same key functionalities. There will be a way to load projects and solutions, lay out controls visually, work with code, and debug with some level of emulation. As a result, once you learn the basics of one IDE, you’ll find you can pretty easily transfer that knowledge to the others.
It is no different moving between Xcode and Visual Studio. In fact, the team at the One Dev Minute blog on Channel 9 put together an excellent summary video that quickly shows a feature-for-feature comparison when putting together a sample app, though it shows older versions of Visual Studio and Xcode.
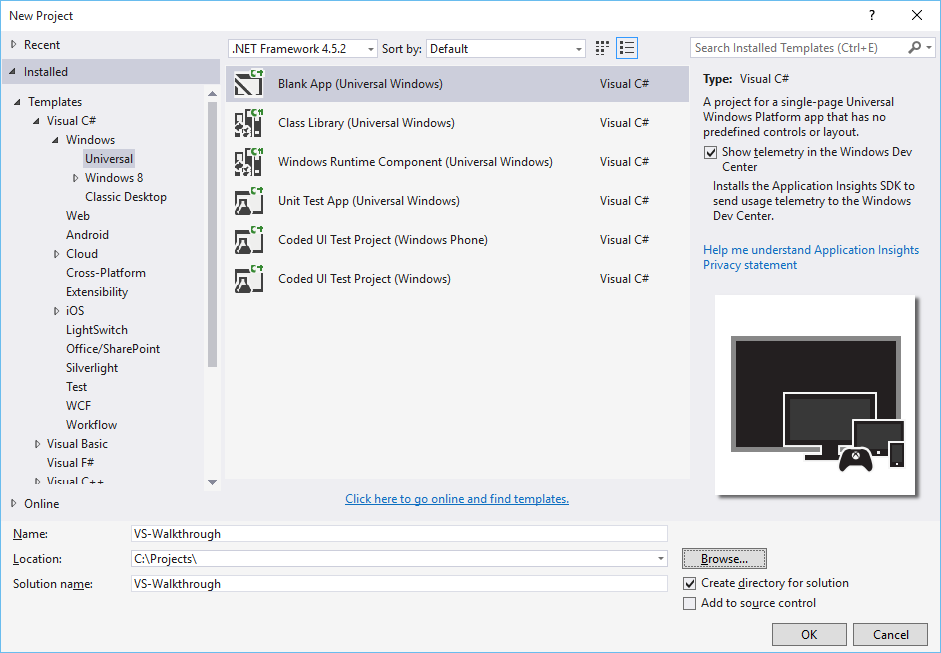
The first step in working with any IDE is loading up a project. In Visual Studio (click here to get the free Visual Studio 2015 Community edition), the steps are basically the same as starting a project in Xcode. Just point to File → New → Project.
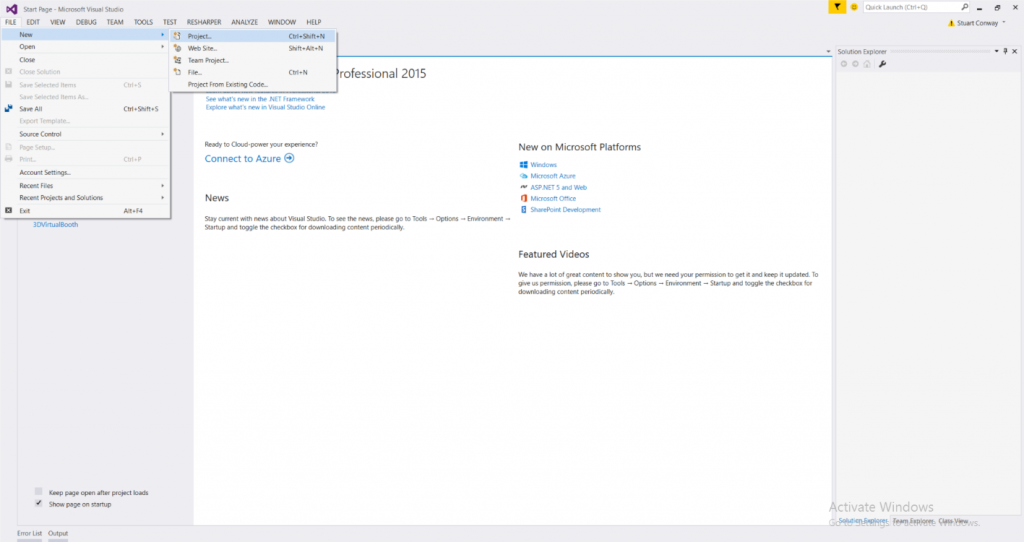
In this case, we’ll pick a project template from a list of installed templates, set the application and solution name, and select the directory where the files will be stored:
After clicking OK, the template creates a runnable UWP app that compiles and runs but contains no UI or data. We selected the Blank App template above. As with all templates, this will create the minimal required files needed for creating an app:
- Packages, libraries, frameworks, and references needed for the app to run
- A manifest file (appxmanifest) that describes your app (its title, description, start page, et cetera) and lists all the files that your app contains
- Code files for your app
- Set of logo images to display in the start menu
- Windows Store app image
- A temporary key file (.pfx) for signing and deploying your app during development
- Splash screen
- XAML (xaml) page to get you started coding your UI
Note: If this is the first UWP app you’ve created with Visual Studio, you will need to set your device to “Developer Mode” in order to run and build applications. In fact, you’ll get the prompt whether or not your device is in developer mode.
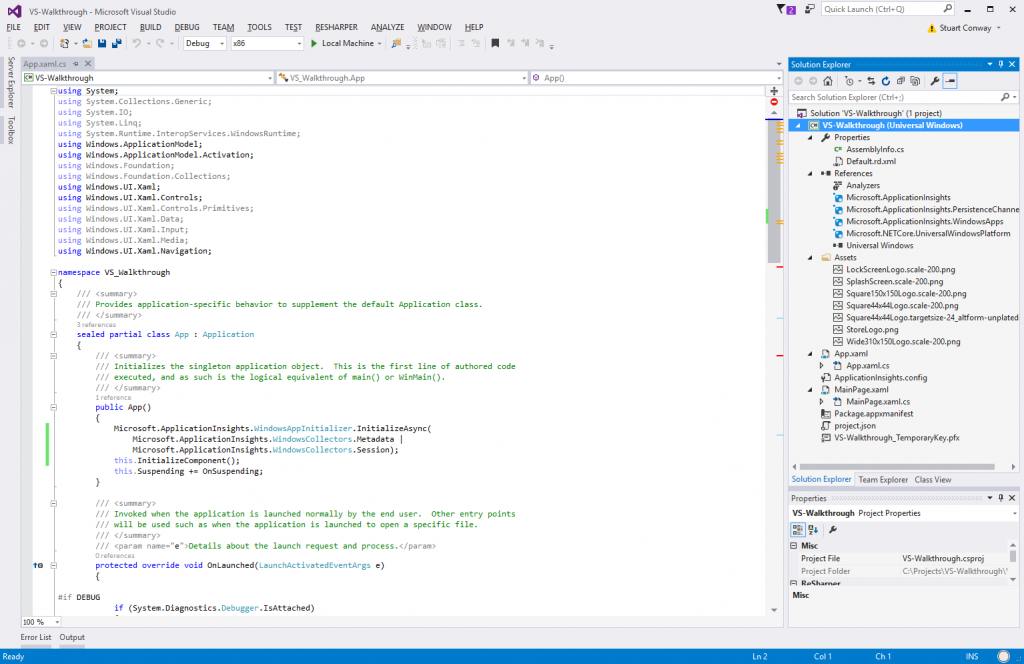
With the project loaded into Visual Studio, let’s explore some of the main windows in the IDE.
Note: The following assumes you’re using the default window layout in Visual Studio. If you change the default layout, you can reset it in the Window menu by using the Reset Window Layout command (in the toolbar, click Window → Reset Window Layout.
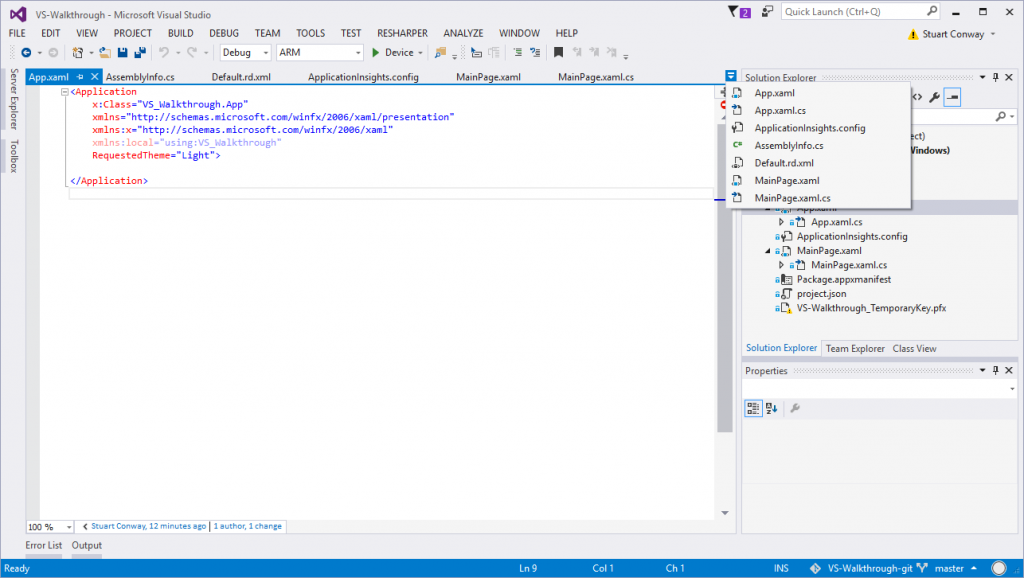
The first thing you will notice is the code window. This window is where you will work directly with the code files used in your application. The code window is tabbed. Every file you open starts a new tab. If you have too many tabs open to be displayed across the top of the window, you can use the drop down arrow on the right to navigate between files.
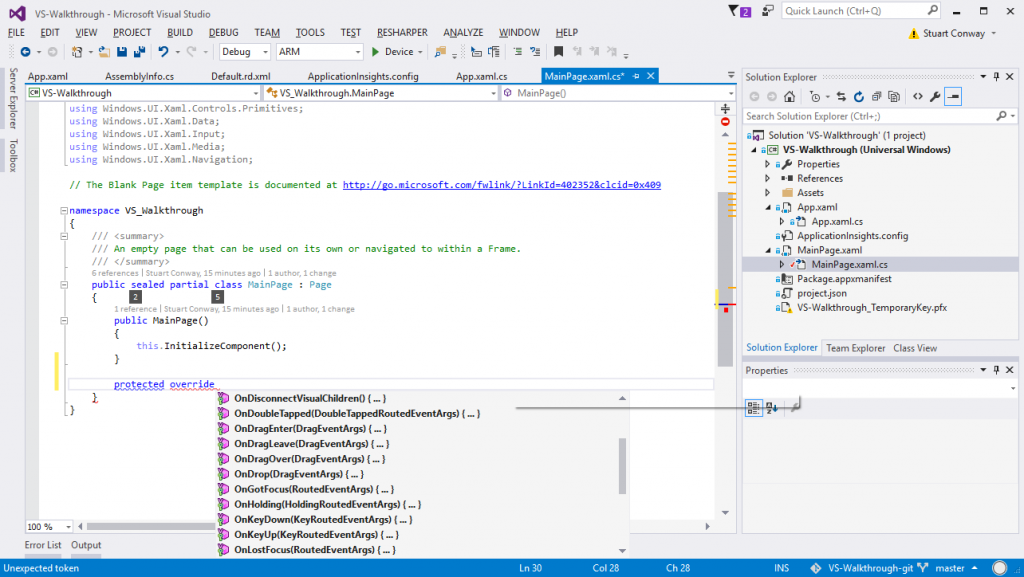
In the code window, Visual Studio provides an amazing Intellisense (or code completion) experience. Just start typing and contextually relevant objects, properties, and methods will be suggested and then filtered down with each keypress.
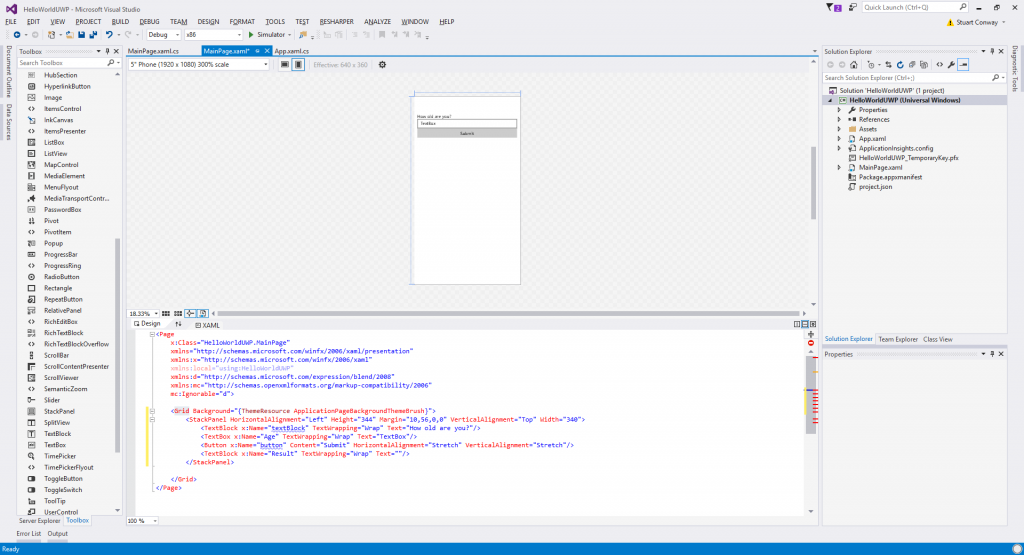
For XAML UI files, you will have the option of editing the XML directly or using Design mode and the drag-and-drop WYSIWYG tools for quickly laying out the UI. Many developers often start in Design mode and then jump into the XML to fine tune. Here, we have opened the toolbar and dragged a variety of UI controls (textbox, button, textblock, etc) onto the design grid:
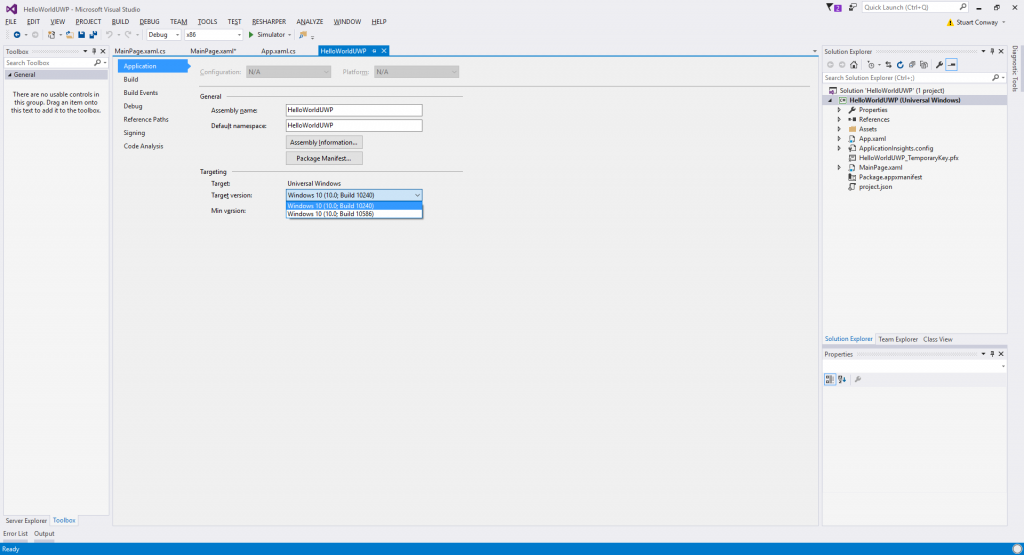
Note: If Design Mode does not show up for you, right-click your project file and, in the application properties page, under Targeting, adjust your target version to the earliest setting. In order to show design elements, the target needs to be equal to or less than the version of Windows installed.
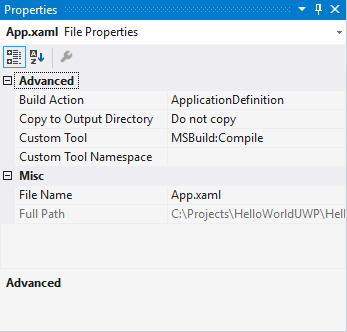
Left and right of the code window are a number of panes for working with the project files. The one you will use most is the Solution Explorer. The Solution Explorer is the hierarchical representation of the file structure of the project. Clicking files in this pane will load the selected file into the code window. Right-clicking and selecting “Properties” from the context menu will load the properties pane for the selected file.
For files, the properties pane is useful for displaying file information or specifying how files are compiled.
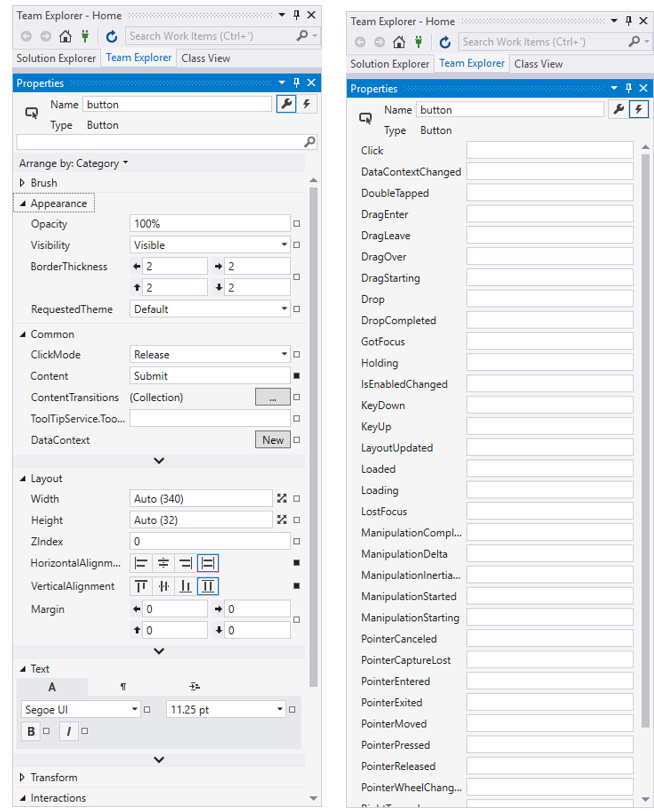
When working in Design Mode, the properties pane is how you specify attributes of UI elements (such as control names, borders, and text) and even assign actions.
When in Design Mode, the Toolbox pane also allows you to drag and drop UI controls directly onto the canvas.
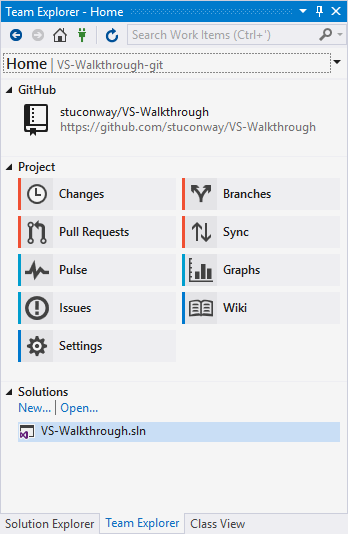
Team explorer is the pane that contains all the functionality for connecting to source control and managing builds, branches, and other settings.
At the bottom, you have the output window and error list. This list is useful for getting insight into the steps the compiler goes through and any errors or warnings you may encounter.
It is important to note that all of the windows and panes are modular and can be dragged and docked to set locations within the main Visual Studio window or dragged out altogether. Find a layout that works best for you.
Now that we have loaded up the code and had a look at the various Windows and Panes in which we’ll be working, what’s the one thing every developer does as soon as a project is loaded? Try to compile it. In Visual Studio terminology, this is called “Build.” Generate the application executable/package causes Visual Studio to analyze the code, search for errors in syntax or logic, validate all references and links, and generate the application executable/package .
When building, you have a couple of configuration options. By default, solutions are loaded in “Debug” mode. Debug mode includes full symbolic debug information in the compiled files to enable easy debugging and does not optimize the binary it produces. You can also change the project to release mode. Release turns on the optimizer and the extra debugging information is not included. Release mode is that last step for final QA, performance testing, and publishing to the app store.
There is a handy dropdown in the upper toolbar that allows you to quickly change between debug and release mode.
You are also provided with a set of emulation options. You can debug in a Simulator, your local machine, or even directly on a device.
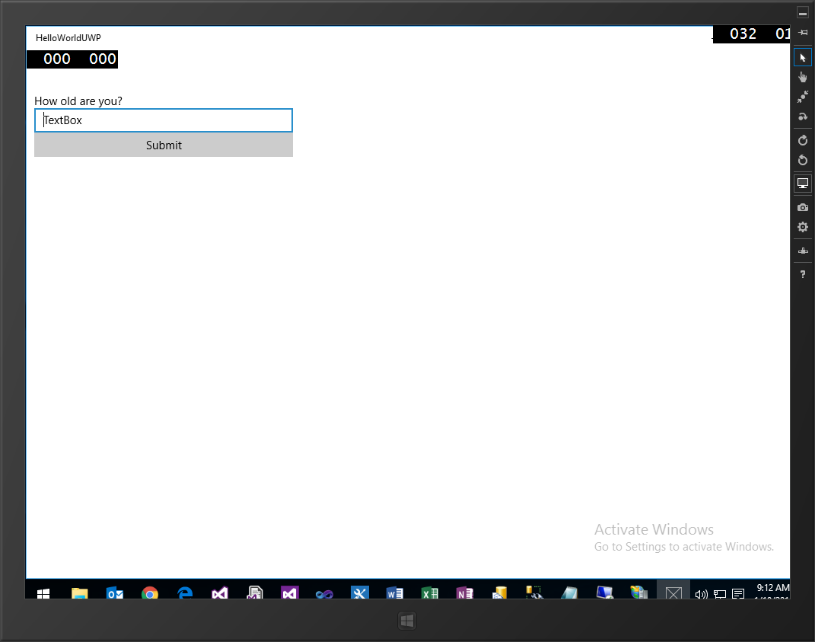
Just select your build options and then click F5 or, from the toolbar, click DEBUG → Start Debugging. The build will start, and once deployed, will launch on the device you selected. Below is a sample of a deployed app using the Simulator. Because the simulator is running on the PC, we choose x86 architecture. If it we were being deployed to a device, you’d choose ARM.
As you build and test your app, you will no doubt encounter errors or need to step through the code. Visual Studio has a great set of debugging tools.
You’ll find some of these debugging tools in a few tabbed panes along the bottom that appeared when you launched the app in Debug Mode:
These panes serve a variety of purposes while debugging. At a very high level…
- Autos—displays variables used on the preceding lines while debugging
- Locals—displays all variables that are currently in scope
- Watch—displays selected variables that you want to watch while debugging
- Call Stack—displays where you are in the code at the current breakpoint
- Breakpoints—displays all defined breakpoints in the app
- Exception settings—allows you to define when to break execution when exceptions are thrown
- Command Window—allows you to execute commands within the VS IDE
- Immediate Window—allows you to execute statements and commands during debugging
- Output—displays status messages for various features in the IDE
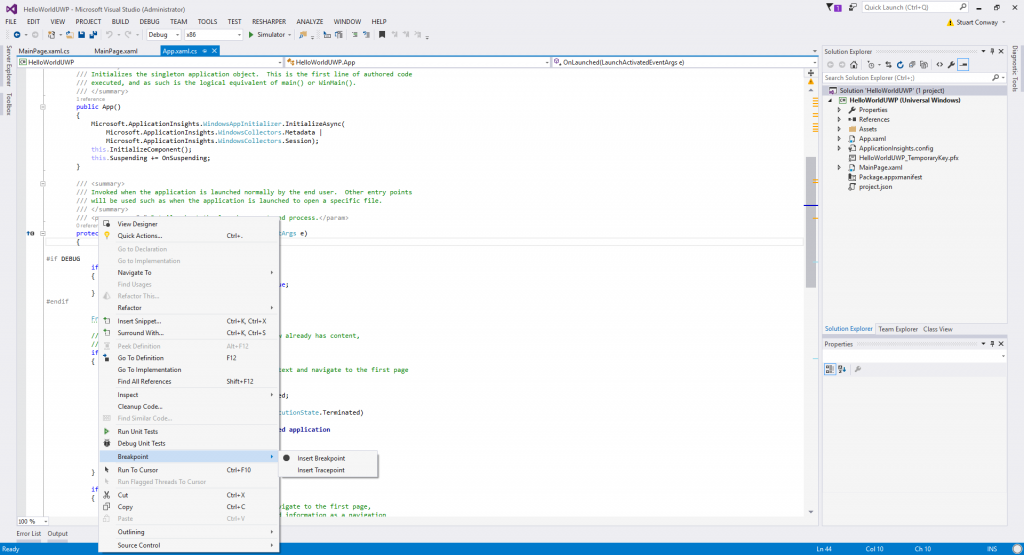
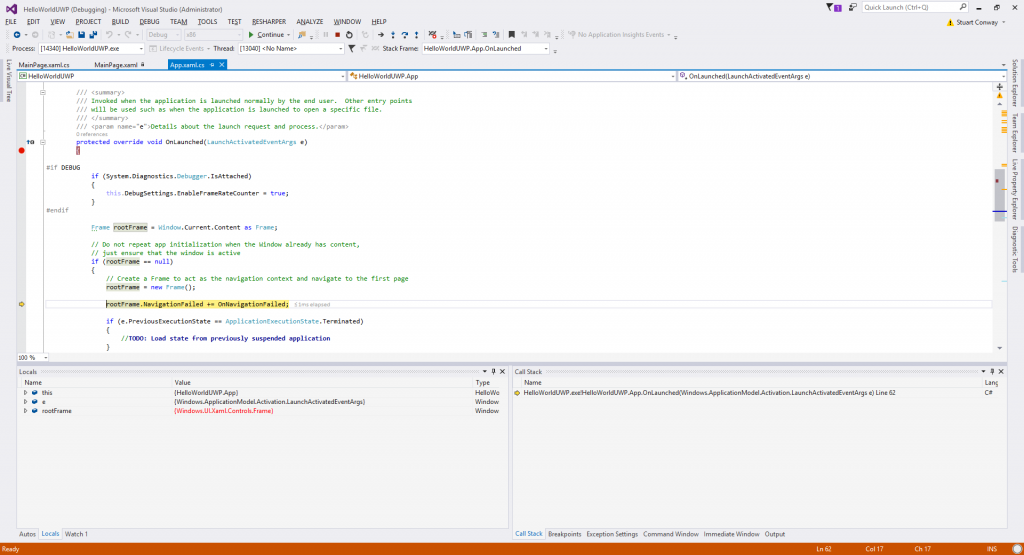
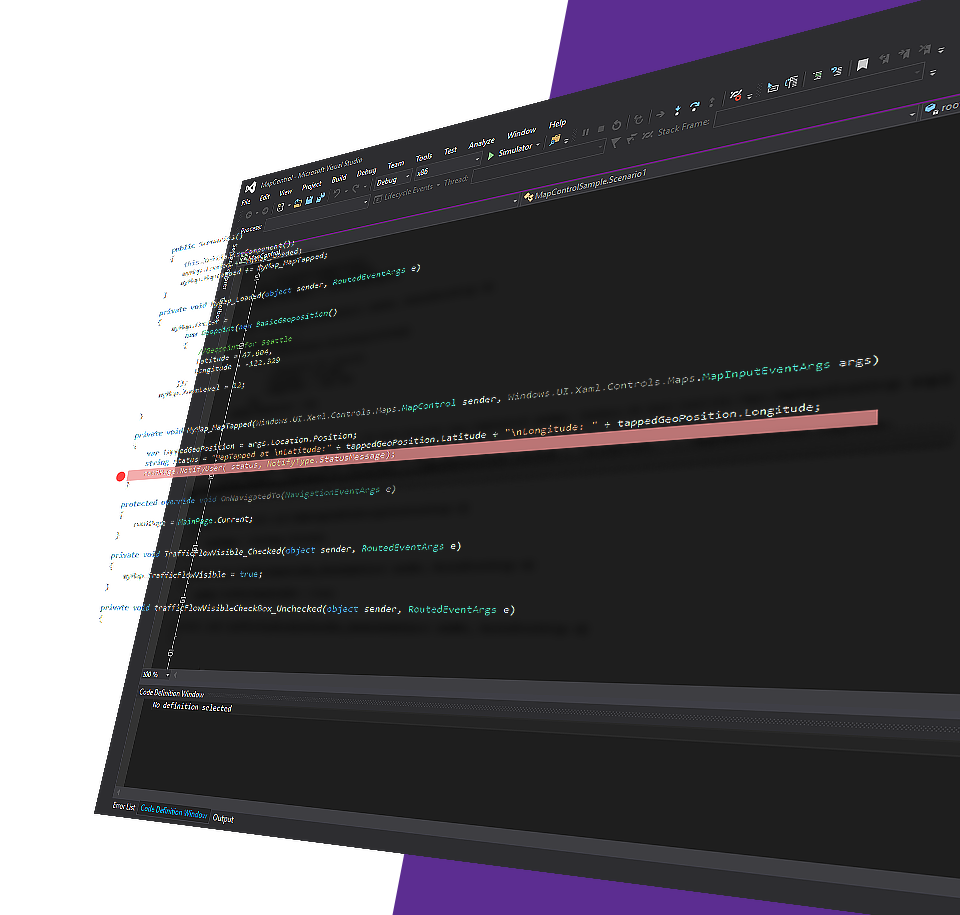
To use the advanced debugging functionality, you will need to define breakpoints throughout your code. You can do this from the context menu or by simply clicking in the far left margin:
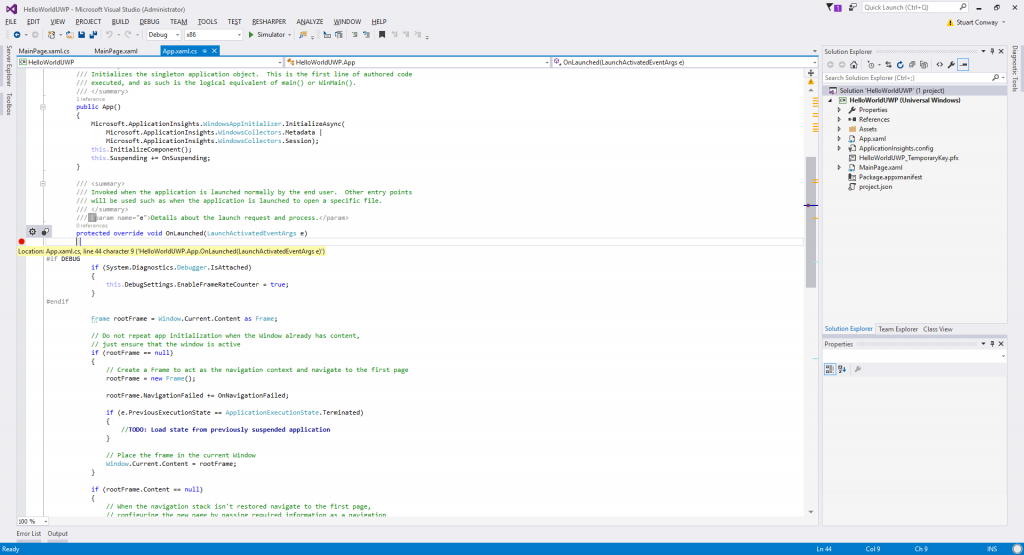
A red circle will be added to the left margin indicating that a breakpoint has been set. With a breakpoint defined, run your app by pressing F5. When the executing assembly hits the breakpoint, execution will be halted. From here, you have a couple of options. Just like in Xcode, you are able to Step Over, Into, and Out of blocks of code while debugging. Visual Studio provides a toolbar button with a corresponding key on the keyboard:
- Step Into. Pressing F11 will continue the execution of the code one statement at a time. If the current line is a method, step to the first line of that method. This is the most granular way to chase down every line of code that is executed.
- Step Over. Pressing F10 will execute the current line. If the current line is a method, it will execute the entire method and proceed to the next line of the current block.
- Step Out. Pressing Shift + F11 will execute the remaining code in the current block and return the cursor to the calling method.
As you step through your code while debugging, the various debugger windows will be populated with information that will allow you to track down issues in the code more easily.
In many cases, you will be working with an existing code base that resides in source control of some sort. Whether it be TFS, Subversion, or GitHub, the process for loading it up is all basically the same.
Let’s take GitHub, for example.
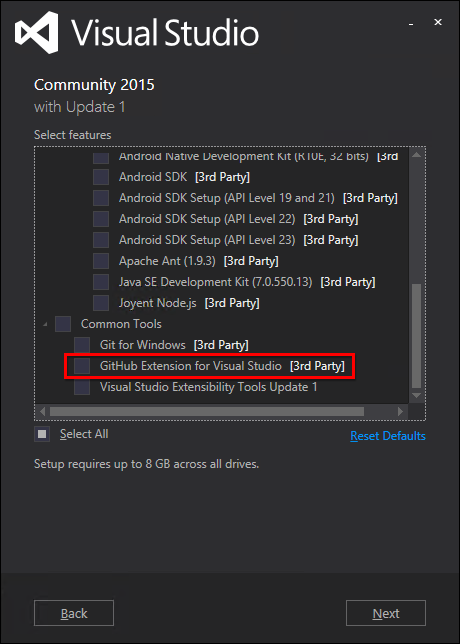
First, you want to make sure you have the GitHub extension for Visual Studio installed (if you didn’t already select the option when installing Visual Studio).
Once the GitHub extensions are installed, let’s “commit” or “check in” the project we just created to our GitHub repository.
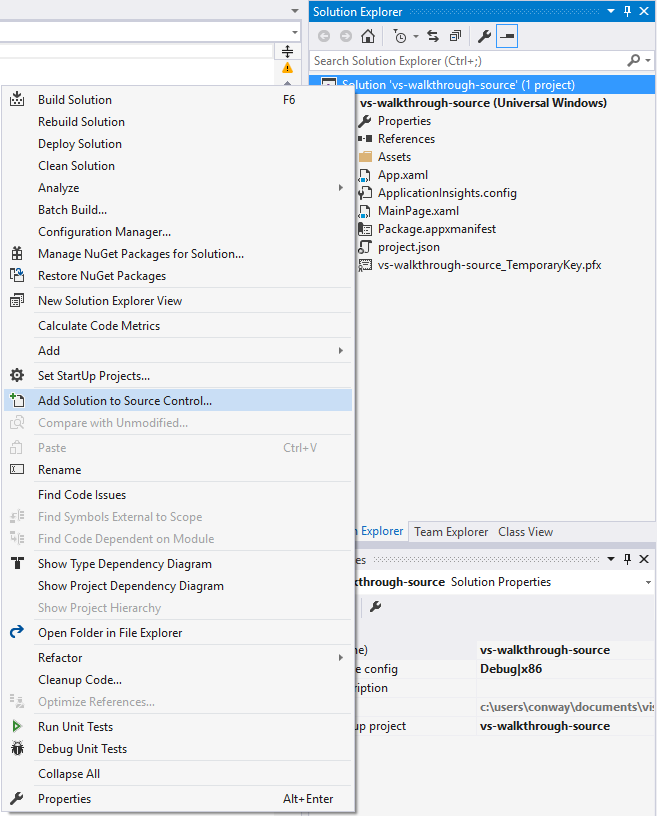
To commit a project to a GitHub repository, in the Solution Explorer pane, simply right-click your solution and select “Add Solution to Source Control.”
You will be presented with a “Choose Source Control” popup window. For this example, let’s choose Git.
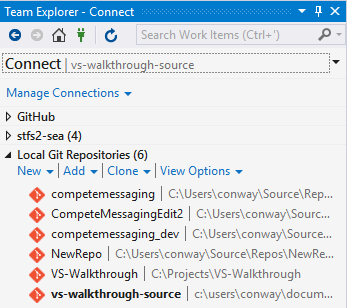
The GitHub extension will then create a new local repository. You can see this by toggling Team Explorer and expanding “Local Git Repositories.”
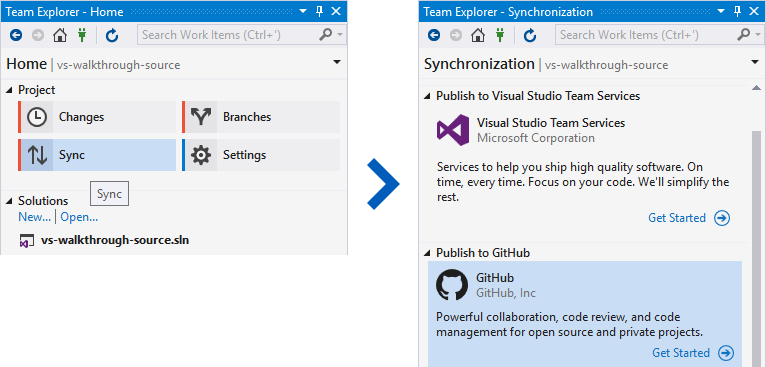
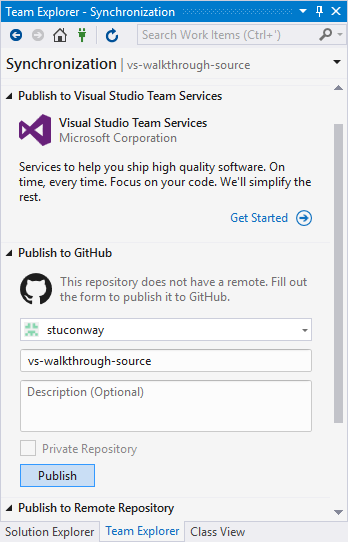
Right-click your newly created repository, then click “Open.” On the Team Explorer Home screen, click the “Sync” button, then click “Publish to GitHub.”
Enter your GitHub credentials (if required), then click the “Publish” button.
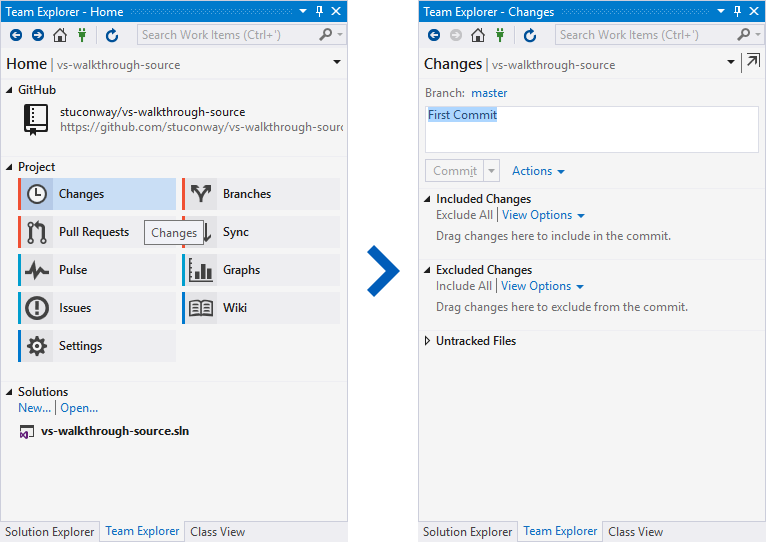
This will create a new remote on your GitHub account. From here, go to the Team Explorer home screen and click the “Changes” button. Enter a “Commit Message,” then click the “Commit” button.
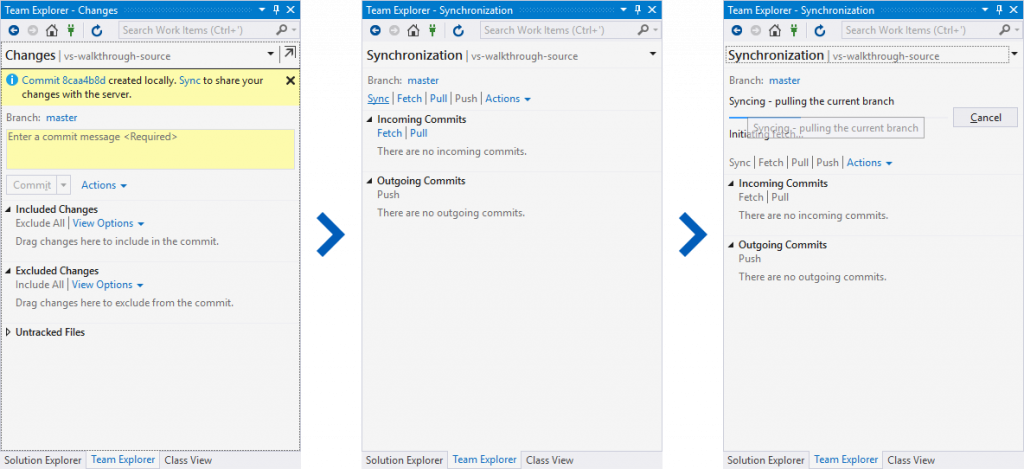
Once committed, “Sync” your changes to the server by clicking the Sync link on the commit success screen and again on the “Synchronization” screen.
The code on your local repository and the code on the server are now synchronized.
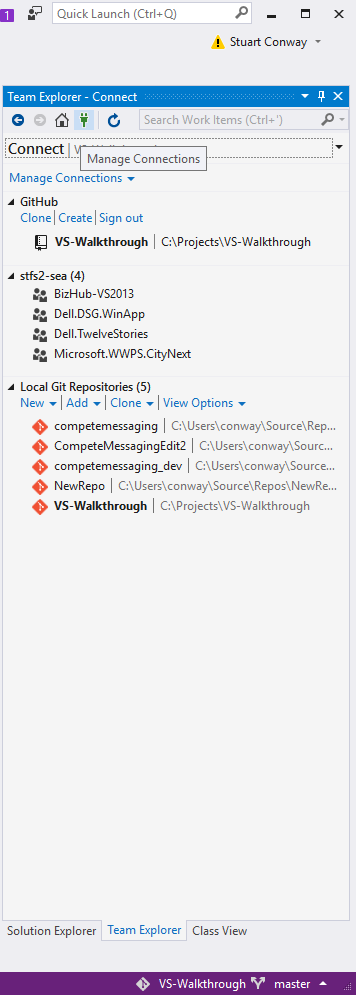
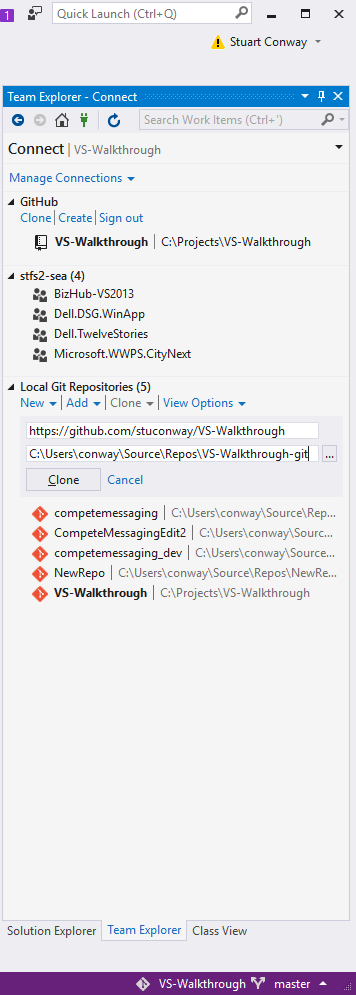
With code already “committed” and “synced” to GitHub, loading a solution is as simple as providing the path to your repository. In the Team Explorer pane, select “Manage Connections” and then the “Clone” link.
In the supplied field, enter the URL to your repository. Make sure the path to your local repository is OK, then click the “Clone” button.
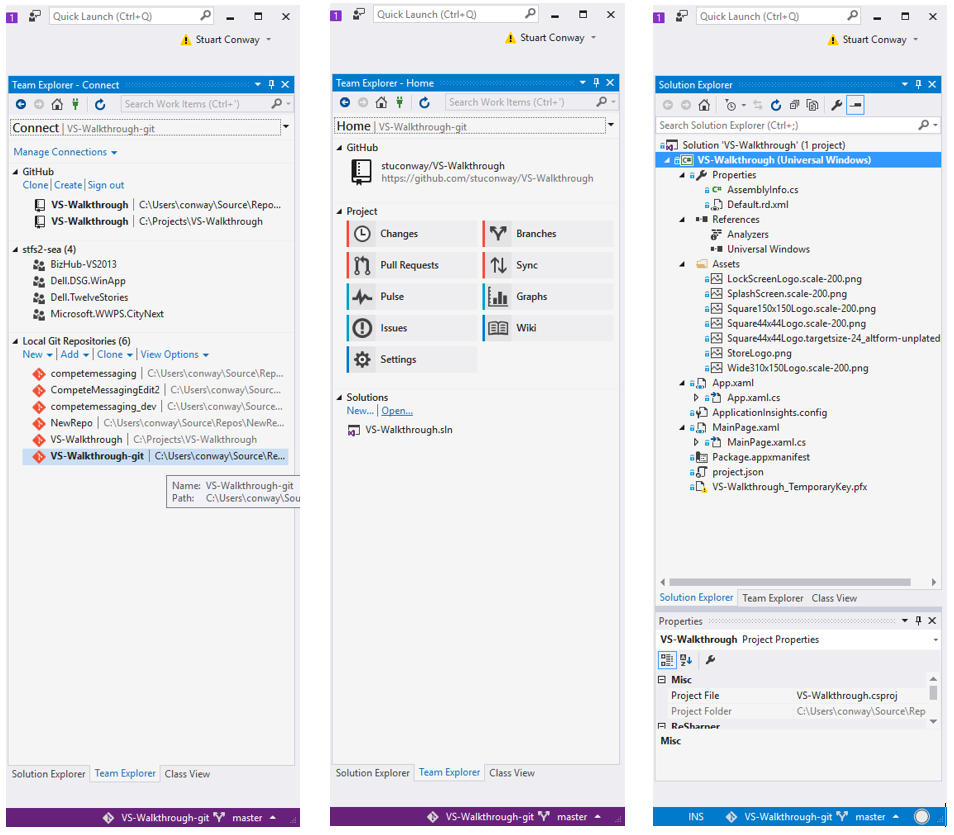
That’s it! You’re now connected to source control and can commit, sync, and manage code and builds. If you double-click your newly created repository, click the “Open” link, and select the “.sln” file, Visual Studio will go out, grab the code, and then load the solution.
As you can see, working in Visual Studio is not very different than working in Xcode. Whether creating and loading projects, working with code, or debugging, the Visual Studio toolset should feel familiar to you.
For more information on Visual Studio and what you can do with it, check out these links:
- Getting Started Developing with Visual Studio
- Personalizing the Visual Studio IDE
- Debugging in Visual Studio
- Tips and Tricks for Visual Studio
For more information regarding Windows Bridge for iOS

