

Intro to LoggingChannel and the ETW viewer
LoggingChannel is a WinRT API introduced in Windows 8 and updated in Windows 10 to support many new features. It sits on top of the ETW tracing APIs, a high-performance system in Windows that lets you fire events during various steps of your programs execution and capture them elsewhere for diagnostics. LoggingChannel and ETW can do a lot more than just log strings – it can track the flow of execution across threads, create activities that wrap subsequent events, and more. In this blog post though, we’ll just look at how to do some basic logging and how to view it in Device Portal using the ETW viewer, which allows you to see any ETW event fired on the system.
Enabling Device Portal
Windows Device Portal is a diagnostic utility in Windows 10 (Anniversary Update) devices – IoT, HoloLens, Xbox, Phone, and desktop. Note that the ETW tracing tool does not come with the Xbox Device Portal, but is accessible on all others.
In order to access the ETW viewer, you’ll need to enable Device Portal and log in to it from your browser. See the previous Device Portal blogpost for details on how to do that. Once logged in, click on the “ETW” tool.
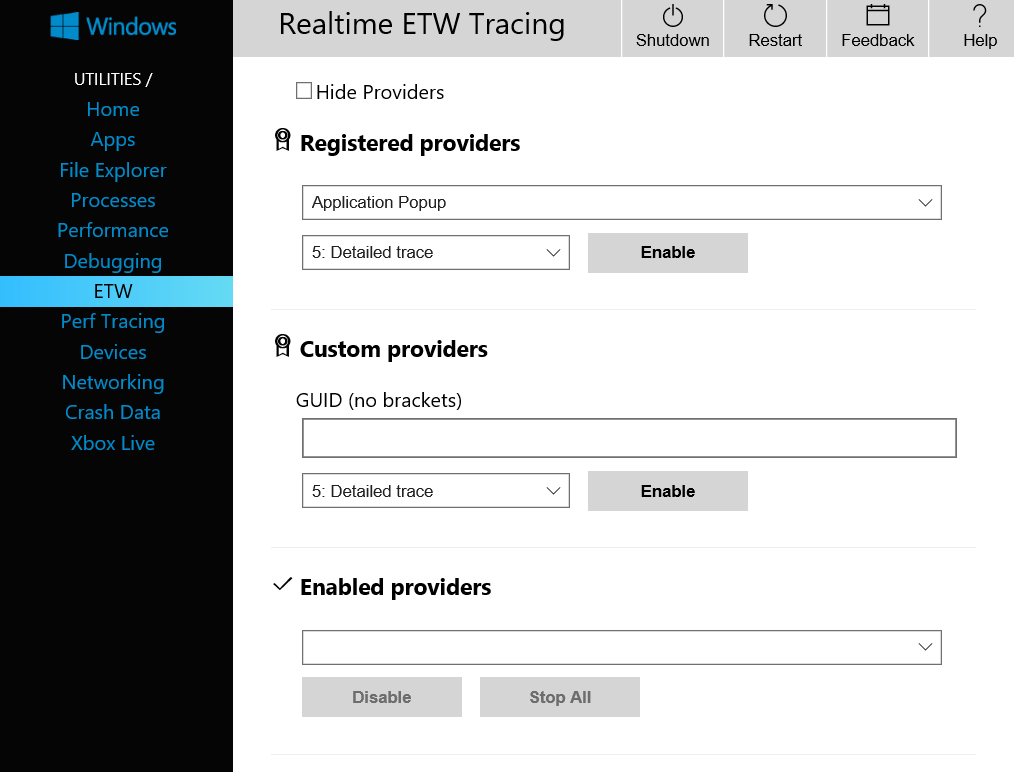
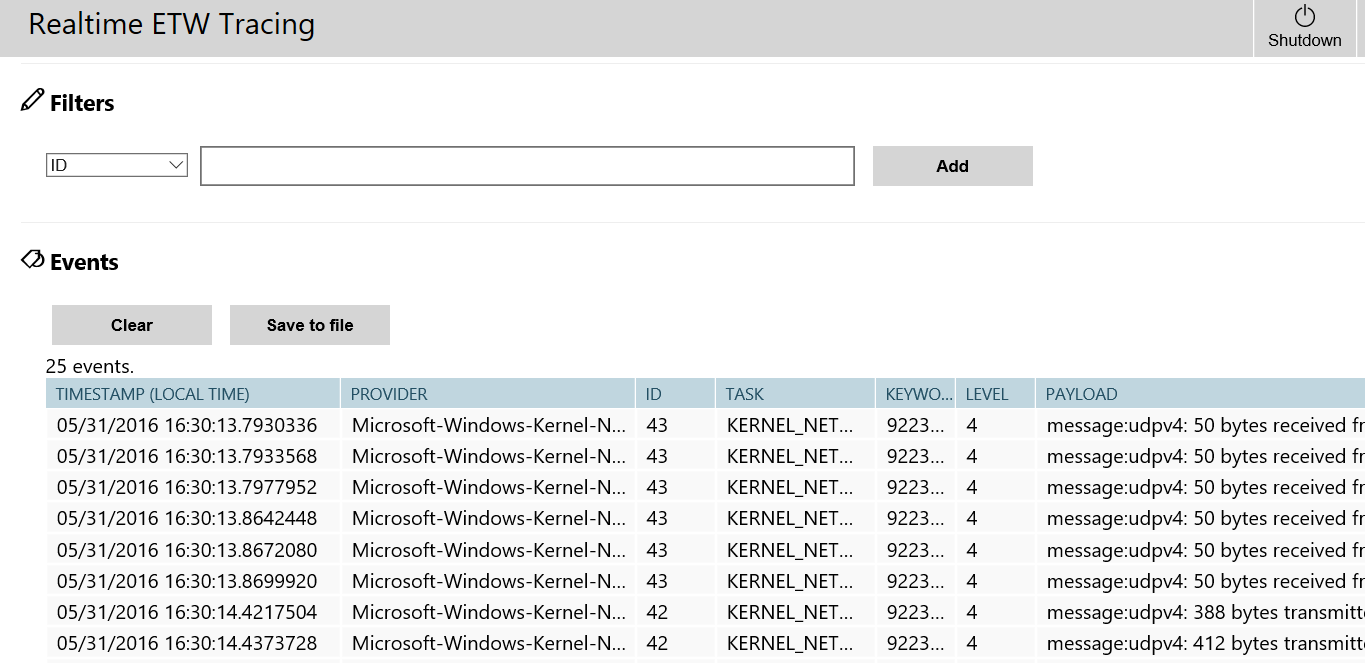
The ETW viewer is primarily 2 tools – a list of providers (event sources) available on the device, and an event viewer. Once you’ve selected a provider and a level to enable it at, you’ll begin to see events in the event viewer. Below, you can see a networking provider firing events for every network transaction.
Adding LoggingChannel to your app
LoggingChannel can be configured to emit events on a custom provider, but to make life easier we’ll be using the existing “Microsoft-Windows-Diagnostics-LoggingChannel” provider to listen for our LoggingChannel calls. Once you’ve opened the ETW viewer, browse through the “Registered Providers” and find “Microsoft-Windows-Diagnostics-LoggingChannel” at level 5. You’ll now see everything logged by a LoggingChannel set to log to that provider.
Getting LoggingChannel working within your app is just a few lines of code:
[code lang=”csharp”]
“`
Using Windows.Foundation.Diagnostics;
LoggingChannel lc = new LoggingChannel("my provider", null, new Guid("4bd2826e-54a1-4ba9-bf63-92b73ea1ac4a"));
lc.LogMessage("I made a message!");
“`
[/code]
There’s a lot going on in those 2 lines though:
| “my provider” | This is the name of the provider being logged to. |
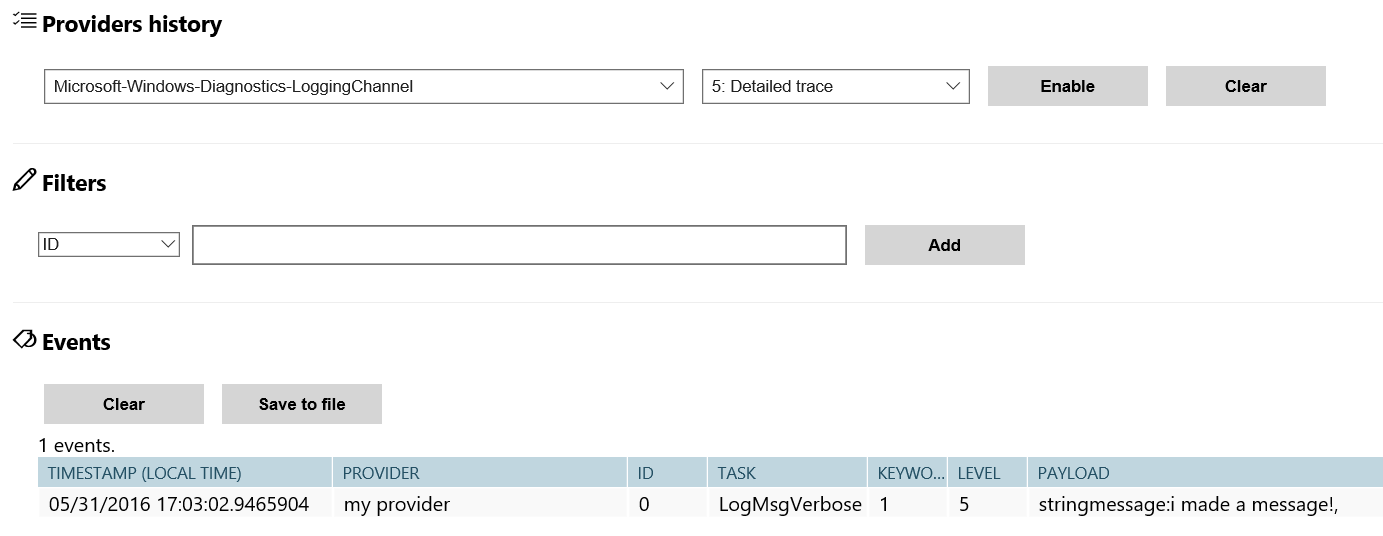
| <Long Guid> | This is the GUID for the Microsoft-Windows-Diagnostics-LoggingChannel provider. This overrides the default provider GUID that LoggingChannel would generate using the provider name, and allows our events to show up on the Diagnostics-LoggingChannel provider instead. Every LoggingChannel has a GUID associated with it – you can get this GUID and type it into the “Custom Providers” input in the ETW viewer to listen to that provider. |
| “I made a message!” | This appears as a “stringmessage” in the event payload. It’s reduced to all lowercase, but it does support Unicode if you’d like to log beyond standard ASCII. |
Using just lc.LogMessage, you can now recreate printf-debugging for your UWP! But we can do better than that with the power of structured data.
Adding more information using Events and Fields
[code lang=”csharp”]
LoggingFields fields = new LoggingFields();
fields.AddBoolean("is easy", true);
lc.LogEvent("making Events", fields);
[/code]
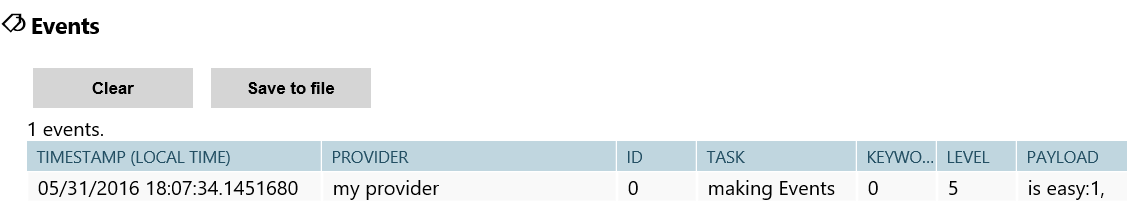
LoggingFields allow you to put multiple objects into an event, and log that. Above, you see a bool being added to a LoggingFields object, and then the fields are emitted using logEvent. This allows you to have easier, more fine-grained control of the Task and Payload fields in the event viewer.
Using Logging Levels to prioritize messages
[code lang=”csharp”]
lc.LogMessage("This isn’t that important", LoggingLevel.Information);
lc.LogMessage("App is crashing", LoggingLevel.Error);
[/code]
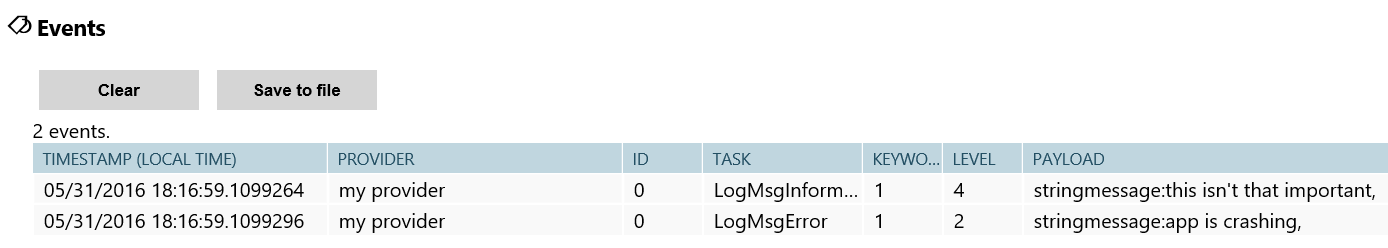
Both logEvent and logMessage support an additional LoggingLevel argument, which allows you to differentiate between important events and more verbose debugging messages. In the image above, you can see that the lower the number, the more important it is.
Between Events, LoggingLevels, and the high-performance ETW system, LoggingChannels provide a simple, yet flexible framework to help you diagnose and debug issues in your app.
Breaking out of the browser with REST APIs
As always, with any Device Portal feature, you can also use the REST APIs that back the web tools to build your own tool on top of this. In a future blog post, we’ll be looking at how you could use this to build a network profiler using just a few ETW providers (the same ones as the Edge F12 tools use!). For now, though, we’ll look at how the tool works behind the scenes.
The ETW logging API is actually just two endpoints – a list of registered providers on the system, and a WebSocket endpoint where you can enable providers (listen to them) and get ETW events. Each ETW provider is stored in the OS as a GUID, and registered ones have a human readable name associated with them. You can get this list with a GET to /api/ETW/providers. Once you’ve gotten the list of GUIDS and names, you’re ready to open a WebSocket to the device.
Sending an upgrade request to /api/ETW/session/realtime creates a WebSocket, allowing you to enable or disable the providers you’re interested in. To kick things off, you can send a message to the server containing the following:
[code lang=”csharp”]
provider [GUID] enable [level]
[/code]
Using a GUID like 7dd42a49-5329-4832-8dfd-43d979153a88 (the Kernel-Network provider) and a level (1-5) will cause the ETW session to start listening for that provider’s event. In the case of this provider, you’ll start seeing them come back immediately, in the form of a JSON array of events. ETW is well-structured data, so each event is simply a set of key-value pairs containing all of the ETW fields. The ETW stream batches all events over a 1-second span and then sends them, to keep from overloading the event handler on the other end of the WebSocket. Thus, with a bit of Javascript you can build a simple network logger that tells you how much data you’ve transmitted in the last second:
[code lang=”csharp”]
function onMessage(evt) //evt is a Websocket MessageEvent
{
var data = JSON.parse(evt.data)
var size=0;
time++;
for (event in data.Events){ //Events is an array of ETW events
size += parseInt(data.Events[event].size, 10);
// You can also get other cool information out of this event, like the addresses being sent to
}
}
[/code]
There’s a lot of power locked up in these ETW events – for example, you can get more information about your UWP installation by listening on the following 2 providers:
- Microsoft-Windows-AppxDeployment
- Microsoft-Windows-AppxDeployment-Server
Listen on these during a deployment and you’ll get back events on what went wrong and what went right during development.
Additional resources
Written by Hirsch Singhal, Program Manager for the Developer Ecosystem and Platform.