

Getting started
I know a lot of you are going to want to dive right in and try it out, so here are the things you should know before doing so.
- Installation – You can install the WinDbg Preview from the Store if you have Windows 10 Anniversary Update or newer at https://www.microsoft.com/en-us/store/p/windbg/9pgjgd53tn86 – WinDbg Preview uses some features from the Windows 10 Anniversary Update, so that’s required for now. The Windows Store lets us release bug fixes and updates to you faster than we’ve ever been able to before, so make sure to stayed tuned to our blog and MSDN to learn the latest about the preview.
- Feedback – Familiarize yourself a bit with the Feedback Hub! We’ve still got a long way to go before we cover all WinDbg features, and we’ll be using the Feedback Hub to help us prioritize what you want us to work on. The Windows Insider website has a great overview on how to give good feedback – https://insider.windows.com/en-us/how-to-feedback. Once you’ve read that, just hit the ‘Feedback Hub’ button on the home ribbon.
- Questions – You’re bound to have a lot of questions, so feel free to post them on this blog post, send feedback in the Feedback Hub or tweet @aluhrs13 and I’ll do my best to answer. We’ll be posting an FAQ on our blog sometime in the upcoming weeks.
- Documentation – We’ve got some early documentation up on MSDN that’s preliminary and subject to change at https://go.microsoft.com/fwlink/p/?linkid=854349. You can give us feedback or propose edits to that documentation by hitting “Comments” or “Edit” on any page. Also keep your eyes on our MSDN blog for more updates and tips.
- Videos – We went to the Channel 9 studio and recorded a couple episodes of Defrag Tools to help explain some of the basics of WinDbg Preview.
- Defrag Tools #182 – Tim, Chad and I go over the basics of WinDbg Preview and some of the features
- Defrag Tools #183 – Nick, Tim and Chad use WinDbg Preview and go over a quick demo
- Coming Soon – Bill and Andrew walk through the scripting features in WinDbg Preview
What’s New
There are a lot of major changes, some of them under the hood and some of them really obvious. Here are my favorites or the things that people have told me they like the best.
Less intimidating
One of the words people often use to describe WinDbg is “intimidating.” When you first open it, you get a dull gray screen and very little indication of what to do next. Once you’re going outside of the stepping icons, it’s difficult to tell what toolbar button or menu is what you want. With WinDbg Preview, we’ve taken a few steps to make it a bit easier for beginners.
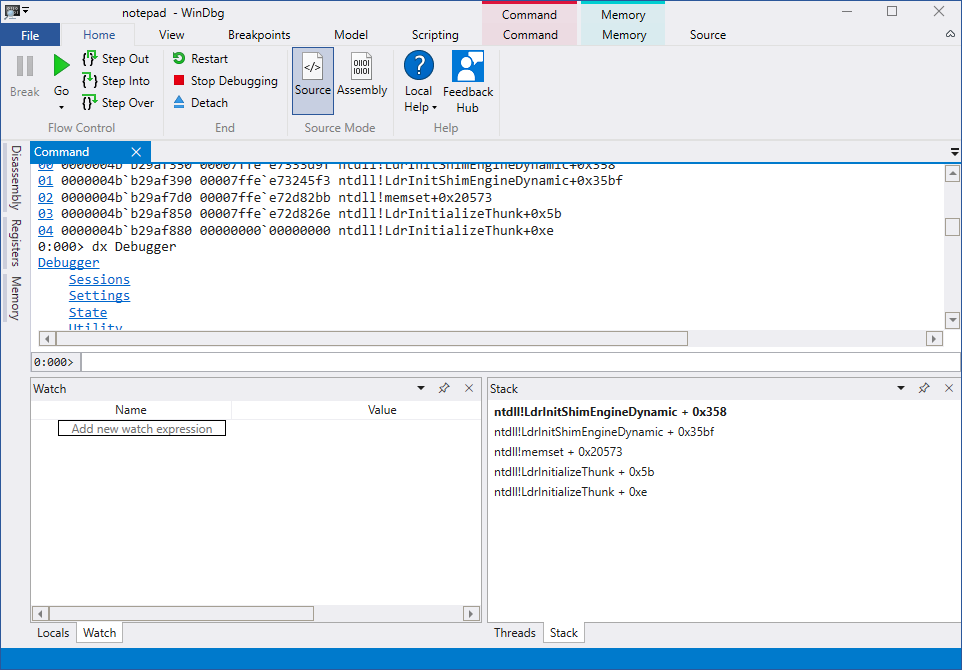
- Ribbon – Ribbons are great when icons don’t do a great job of describing an action and when there are a lot of different contextual actions that are only sometimes relevant. Right now our ribbon is pretty barebones with the basics, but over time we’ll be adding more ribbons for specific contexts while you’re debugging.
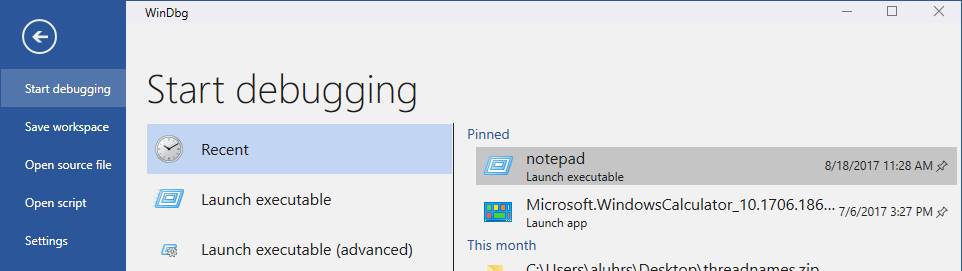
- Re-worked file menu – The new file menu makes it much more clear which options you have for starting and configuring your debugging session. The attach dialog is much cleaner and more organized now and, there’s even a new option to launch your Store App or background tasks without needing to set it up with PLMDebug.exe.
- Familiar source windows – Source windows now are better in pretty much every way and should look more like the source windows you’re used to seeing in every other modern editor.
Quality of life improvements
WinDbg has gone a long time without any major quality of life improvements or modernizations. This has led a lot of people to doing registry hacks to get a prettier theme, or having a dozen icons pinned to their taskbar for each thing they debug often. We’ve taken some of these work-arounds and made them easy to access.
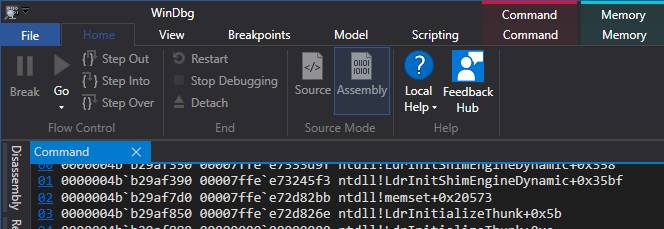
- Dark theme – This one is pretty self-explanatory. A lot of people use dark themes in their editors and then flip over to the glaring brightness of WinDbg. Now it can match!
- Recent targets – Instead of having to have your KDNET key and IP on a sticky-note on your monitor, WinDbg Preview will now remember all your recent sessions and some of the settings that you had during that session. You can quickly access them again from the recent targets list in the file menu.
- Various window improvements – Many windows have gone a while without updates or just have glaring bugs. Some of the notable things we’ve done differently are that the disassembly window keeps its highlighting in the right spot when scrolled, and the memory window has better highlighting and scrolling. Many windows are also asynchronous now and loading can be cancelled by running another command.
Data model front and center
Hopefully you’ve heard about the debugger data model by now. If you haven’t check out some of my older blog posts and our MSDN docs linked above. Up until now, the data model was only accessible through JavaScript and the dx command. With WinDbg Preview, we’re putting the data model under the vast majority of what you see, making it much more extensible.

- Extensible locals and watch – The data model is now powering the locals and watch windows. NatVis and JavaScript extensions that extend the data model will be reflected in those windows. You can even put LINQ queries into the watch window!
- Model windows – There’s a new type of window called a model window. Model windows will show the results of any model query in a normal hierarchy view or a table. You’ll see in the FAQ that WinDbg Preview doesn’t have a modules window, but you can use a model window to make your own with @$cursession.Modules! This also has the benefit that if you make a JavaScript extension that extends modules, it’ll automatically update your window.
- Built-in scripting environment – One of the biggest complaints with scripting and extending the debugger is having to go into an IDE to write and iterate on it. With WinDbg Preview you can write and execute your JavaScript and NatVis directly from the debugger. The script window has error highlighting, IntelliSense and easier execution of scripts.
Restrictions and other things worth noting
While we’ve got that big list of what’s new and awesome, this is still a preview, so there’s some things that you should be aware of:
- At this point in the preview, we’re only offering WinDbg Preview through the Windows Store. That means only devices running Windows 10 Anniversary Update can install it.
- You might hit errors when trying to do something that requires elevation. You’ll have to manually launch WinDbg Preview elevated.
- The concept of a workspace is going to be changing a lot. A workspace in WinDbg Preview is vastly different from one in WinDbg. The MSDN documentation linked above has more information.
That’s where we are today. The core experiences are there and we’ll be releasing improvements faster than our normal pace now that we’re shipping from the Windows Store. Please don’t hesitate to send us feedback and feature requests in the Feedback Hub or in the comments below. We want your input as we move forward!