In a previous blog post, we talked about how to use geofences to make your apps smarter and more useful by having them respond to changes in the user’s location. With geofencing, your apps can do things like remind the user to pick up some milk when he or she is near a grocery store, or present a coupon for a nearby shop. The geofencing features in Windows 8.1 do this for you in an intelligent and power-efficient manner. This blog post complements the previous post by discussing how to test and debug your geofencing apps. Because geofencing depends on a device’s location, we’ll present you with a variety of techniques for verifying that your app is working correctly before you submit it to the Windows Store.
The basics
First, let’s review some testing and debugging basics for geofencing. Here are some ways to test your geofencing app:
- Physically move the device to new locations. Obviously, this is not always practical because there are limits to how far you can move the device around in a day.
- Test entering a geofence by creating a geofence region that includes your current physical location, so you’re already inside the geofence and the “geofence entered” event is triggered immediately. This works great for the entered event but doesn’t work for all geofencing scenarios.
- Use the Microsoft Visual Studio simulator to simulate locations for the device. This is a great tool for simulating locations all over the world without physically moving your device.
Using the Visual Studio simulator
If you do use the simulator to test your app, you’ll follow different steps depending on whether your app is running in the foreground or the background.
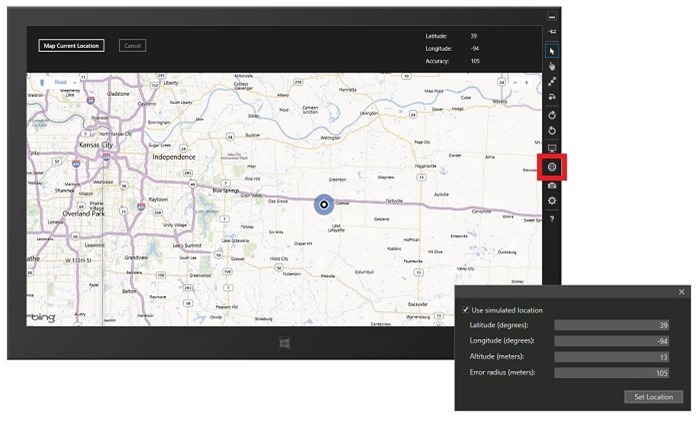
If your app is running in the foreground, the steps are fairly straightforward: first build your app and launch it in the Visual Studio simulator, and then use the simulator to test various locations inside and outside of your geofence. You can also test to make sure the properties, such as StartTime, Duration, DwellTime, and SingleUse, are working properly.
Here’s a look at the simulator’s UI.
To test apps running in the background, there are a few more steps:
- In your app’s manifest, declare the Location background task type and set the badge assets, or badge and tile assets, for the lock screen.
- Add your app to the lock screen. You can do this by building and deploying the app locally. Then accept the prompt to add the app to the lock screen and to enable location permissions. You can also manually add the app to the lock screen in PC settings > PC and devices > Lock screen.
- Close the app on the local machine.
- Start debugging your app by launching it in the Visual Studio simulator. Note that background geofencing simulation is supported on only one app at a time within the simulator. Don’t launch multiple geofencing apps within the simulator.
- From the simulator, simulate various locations inside and outside of your geofence region. Be sure to wait long enough past the DwellTime to trigger the event. For more info about simulating locations, see Set the simulated geolocation of the device.
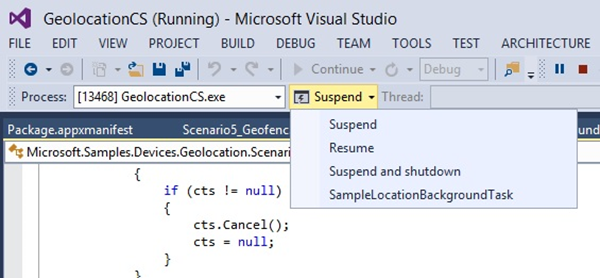
- Use Visual Studio to trigger the location background task, as shown in this screen shot. (For more info about triggering background tasks in Visual Studio, see How to trigger background tasks.)
What if I need to dig deeper?
So what happens during testing if you don’t see a geofence event fire when you expect it to? Or if you’re not sure whether your hardware is working correctly? What if there’s a deeper issue with your code? You can use tracing see what the system is doing and what events are being fired, so you can investigate further into what’s going wrong. Setup takes a little time but the rich info you get can be worth it for more complicated scenarios.
To set up a tracing environment, first install the Windows symbol package for your system. You can find and download the correct symbol packages by following the instructions here. After the symbols are installed and you’ve set their symbol path, install the Windows Driver Kit (WDK) from here. This installation includes the TraceView, TracePDB, and TraceFmt utilities, and also enables tracing from the command line.
Using TraceView
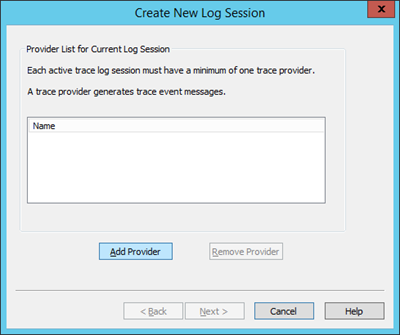
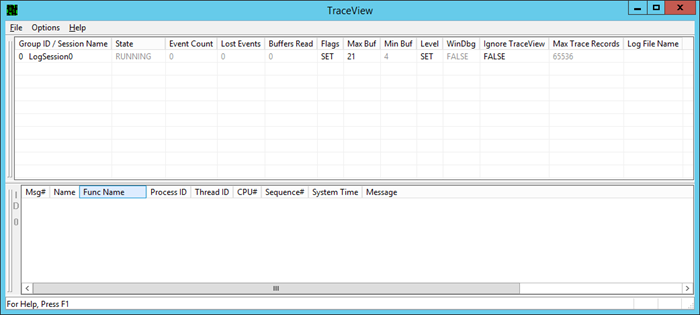
Launch TraceView from wherever you installed the WDK and then select Create New Log Session from the File menu.
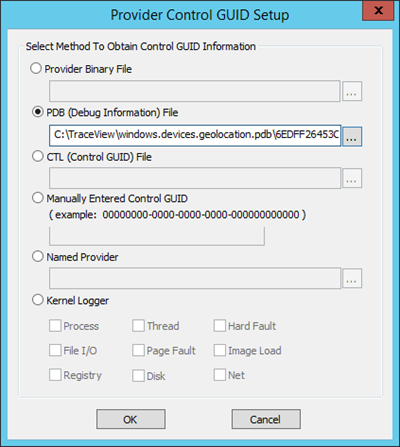
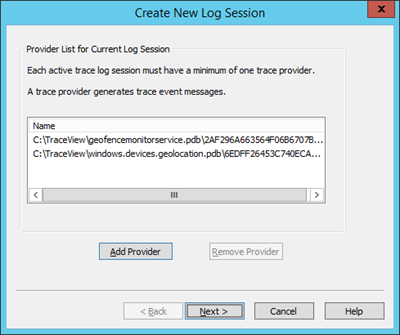
Select Add Provider and then select the PDB (Debug Information) File radio button. Enter the path to the PDB file for Windows.Devices.Geolocation.pdb, which will be wherever you installed the symbol files.
Select OK, and then repeat these steps to add the provider for GeofenceMonitorService.pdb.
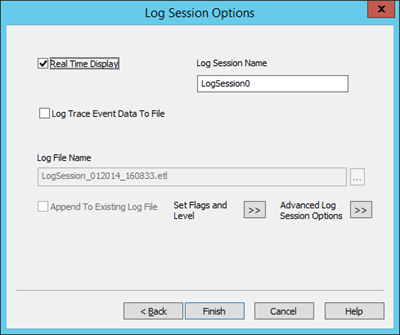
Select Next.
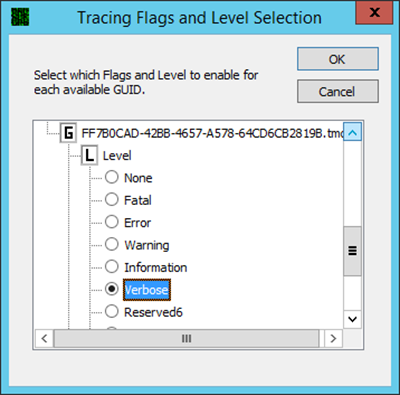
Select Set Flags and Level. Double-click Level under FF7B0CAD-42BB-4657-A578-64CD6CB2819B (the GUID for the Geofencing Service) and select Verbose.
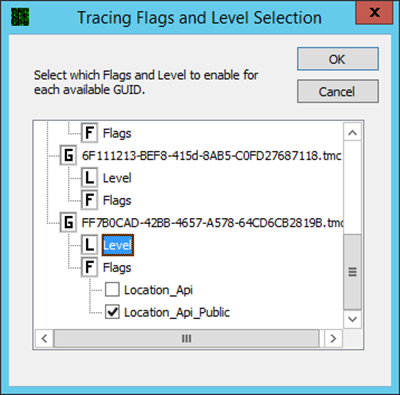
Double click Flags under FF7B0CAD-42BB-4657-A578-64CD6CB2819B and select only Location_Api_Public.
Click OK and then, in the Log Session Options dialog, click Finish. In the lower window, add the Func Name field to the column header by right-clicking the column header and choosing “Func Name” from the header column options.
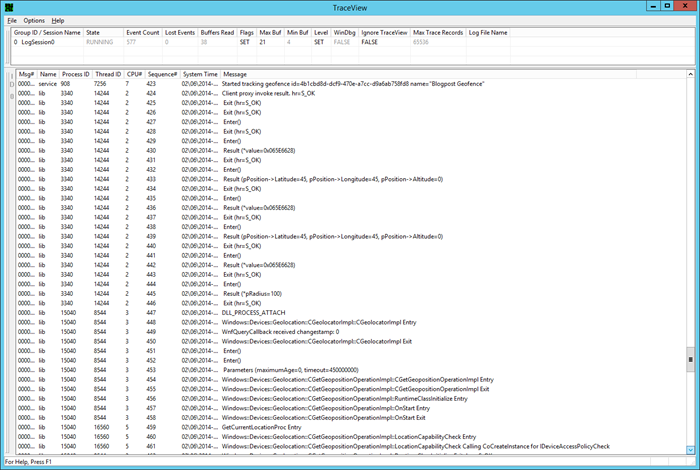
You can now run your geofencing program and trace geofence messages coming through the system. For example, creating a geofence results in the following trace info.
If you try to create a geofence with an invalid value, like a latitude of 450 degrees, you’ll see the following trace info.
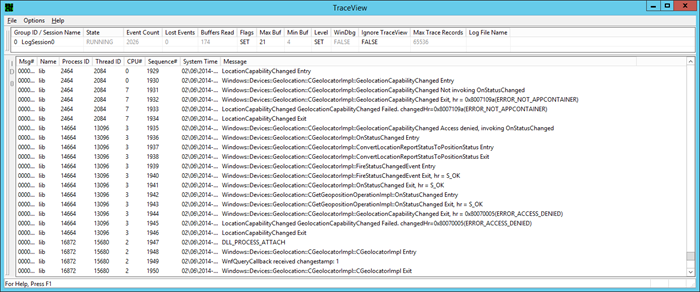
If the location permissions change, you can see that reflected in the trace info also.
Command line
You can also do traces from the command line. First let’s set things up. Open an elevated command-prompt window and create the trace collector.
logman create trace -n LocationTrace -o %SystemRoot%TracingLocationTrace.etl
logman update trace -n LocationTrace -p {FF7B0CAD-42BB-4657-A578-64CD6CB2819B} 2 5
Now we’re ready to start the trace.
logman start -n LocationTrace
Run your geofencing program to capture the trace info. Then you can stop the trace.
logman stop -n LocationTrace
When you have stopped the trace, you will have a Windows trace log (.etl) file that you can either open in TraceView or convert to a comma-separated value (.csv) file that you can look at in Microsoft Excel. Here’s how to convert the .etl file to a .csv file.
tracepdb -i C:Windowssystem32Windows.Devices.Geolocation.dll -p C:WindowsTracing

tracepdb -i C:Windowssystem32GeofenceMonitorService.dll -p C:WindowsTracing

tracefmt C:WindowsTracingLocationTrace.etl -p C:WindowsTracing -o LocationTrace.csv -csv -csvheader –noprefix
Note that logman typically adds a suffix to the LocationTrace.etl file created from the trace. For example, the file may be named LocationTrace_000001.etl.
Happy geofencing!
There you have it – a whole range of techniques for testing and debugging your cool new geofencing apps. Obviously, you want to start with the simpler techniques and then work your way to more in-depth tools as needed. We hope this post helps smooth the development of your geofencing apps from start to submission.
–Ross Heise, Senior Content Developer, Windows Developer Content
Special thanks to Frank Gorgenyi, Janet Schneider, and Jon Kay for their help and contributions to this post.

