

Changes of note for April 2015:
- Windows and Windows Phone 8.1 Adoption: As the vast majority of our users are now using the latest version of the OS, it is the right time to prepare for Windows 10 by moving your apps to Windows and Windows Phone 8.1.
- Downloads by Category: Games keep growing as a percentage of total downloads on both Windows and Windows Phone, so making your apps universal will help you reach both audiences.
- Categories with Opportunity: Downloads in the Photos category on Windows Phone had significant growth this period, opening up opportunity in this category.
- Downloads by Market and Language: We saw a significant uptick in downloads from Brazil, India, and Vietnam this quarter. Ensure your apps are published in these markets and localize for Brazilian Portuguese and Hindi to drive maximum engagement in these markets.
- Monetization: In-app purchase continues to grow and in March was the leading source of revenue for developers on the platform.
Windows and Windows Phone 8.1 Adoption Trends
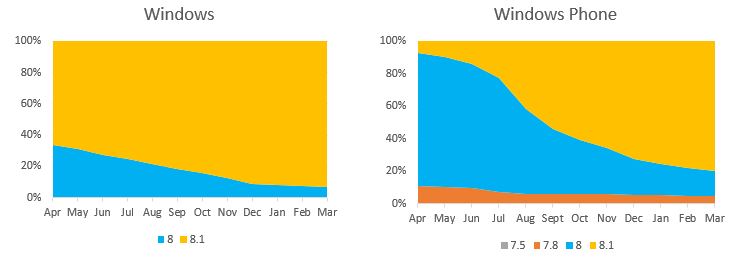
In March 2015, approximately 93% of Windows Store downloads were from customers running Windows 8.1 and 80% for Windows Phone. This adoption trend has been steady over the last two quarters, which is strong indicator that now is the time to invest in apps that support 8.1.
Windows and Windows Phone 8.1 provide the benefit of increased functionality for customers, and enabling your app for 8.1 on any device allows you to easily convert to a universal project and manage one set of source code to target both Windows and Windows Phone.
Creating universal Windows apps now will also make it easy for you to adopt on the Windows 10 platform more quickly and gain an early advantage in the Store with apps ready to download upon release.
The two graphs below show the download sources for both Windows and Windows Phone apps and games, and that Windows 8.1 and Windows Phone 8.1 have been the primary operating systems over an extended period of time.
Windows Phone Device Breakdown
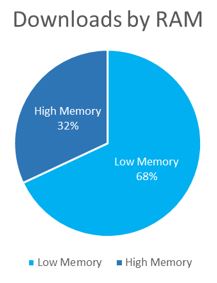
The chart below shows the percentage of downloads by device memory. With 67% of app downloads now coming from low-memory devices, you can more than double your potential market by optimizing your app to run on low-memory devices. If that’s not possible, consider creating a version with lower memory requirements to offer alongside your primary app. It’s important to note that for Windows Phone 7.x devices a low-memory device is defined as 256MB or less of RAM, but on 8.x devices low-memory is 512MB or less of RAM. (The chart accounts for this distinction.)
Downloads Per Category
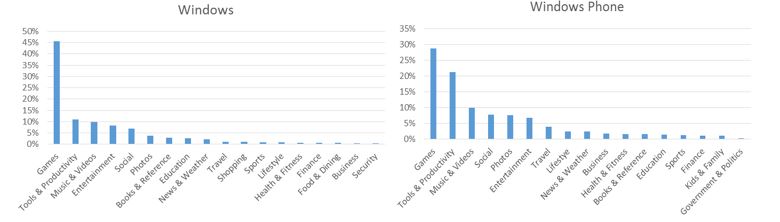
Games continue to be the most popular category for all devices, along with Tools & Productivity, Music & Videos, and Social. Since we began posting these trend updates, we’ve seen categories and rankings become fairly stable. The main exception has been the Games category for Windows, which continues to grow and now accounts for over 45% of windows downloads. If you’re a game developer, consider evolving your Windows Phone app to support universal Windows apps and take advantage of the download potential on Windows.
Categories with Highest Incremental Download Opportunity
Understanding which categories have the highest ratio of downloads per app can also be helpful. This is a function of total downloads versus total available apps in that category. For example, while Games is the most-downloaded category, Social has more downloads per available app.
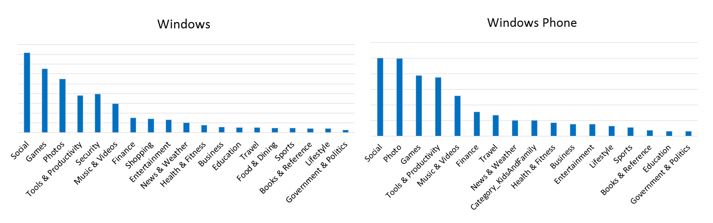
Games and Tools & Productivity are again in the top five for both Stores, a trend that has been steady for the past 9 months. We’re starting to see some change as new device technology begins to gain traction. For example, while Social is still the #1 category in both Stores, Photo has been growing steadily and is now a very close #2 on the Windows Phone platform. If your goal is to reach the maximum number of downloads possible, analyze these categories to understand which one presents the highest potential for your apps.
Downloads by Market
Windows Store is available in 242 markets, and Windows Phone Store in 191 markets. As you localize your apps for customers outside your home market, consider which other markets are generating the largest number of downloads and if they might be relevant to your apps.
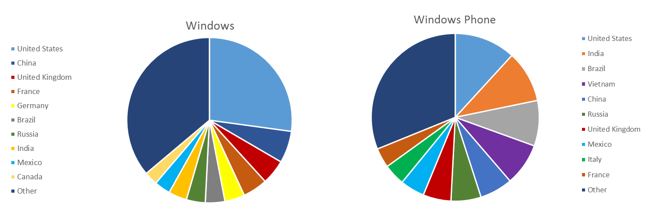
While the United States is the market with most downloads on both platforms, other markets have grown rapidly. The addition of carrier billing in India, Brazil and Vietnam has resulted in a significant uptick in app and in-app purchase downloads in these markets. With low credit card penetration in these markets, the addition of the carrier billing option has brought subscribers previously unable to purchase from global app stores into the Windows Phone Store. With 87 partners in 51 markets, carrier billing provides these users with a convenient 1-click way to buy apps, games and in-app content, and we see total paid transactions typically increase 8x in emerging markets. For more information about recent carrier billing announcements and the customer reach potential, please refer to this blog post: Windows Store is first to bring carrier billing to China, India and Brazil.
The distribution of downloads shows there are other markets generating a significant number of downloads, such as China, France, United Kingdom, Mexico and Russia. That doesn’t mean, however, that you shouldn’t consider tailoring your apps for other markets as well. Your apps may have specific characteristics suitable to these markets.
Windows Store Customer Languages
Language is a key driver of downloads and adoption. You can extend the reach of your apps by supporting additional languages.
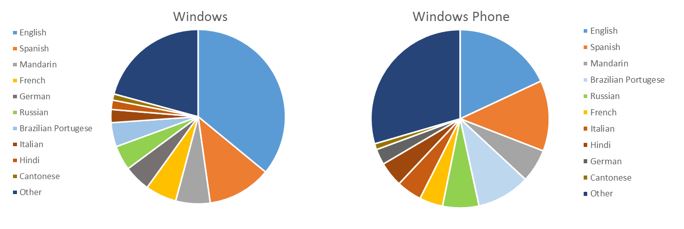
Offering your apps in English only will reach 16% of Windows Phone customers, but supporting the top 10 languages will reach 65% of total users. In line with the increasing downloads from India and Brazil, we’re seeing Brazilian Portuguese and Hindi languages grow this quarter by 2% and 3%, respectively. English continues to represent a significant market share (30%) of tablet and PCs users. Don’t know where to start? Learn how to localize your Windows and Windows Phone apps.
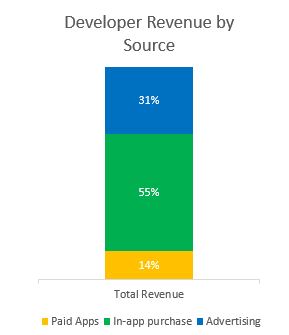
Monetization Options
Another important decision is which monetization models to adopt: paid apps, in-app purchase, or in-app advertising (showing ads in the app). Paid apps continue to decline as a percentage of overall revenue as well as in absolute revenue, although paid apps continue to be an important revenue source for specialized apps, particularly on the Windows platform.
In-app purchase (IAP) is back on top as the number one revenue generator for developers, accounting for over half of the revenue in each category. While IAP continues to grow in total revenue month over month, we saw an even larger spike in IAP revenue share over the last quarter, driven by introduction of new apps since our last post such as Age of Empires: Castle Siege, Age of Sparta, Asphalt 8: Airborne, Candy Crush Saga, Dragon Mania Legends, My Talking Angela, and The Sims FreePlay that rely on the IAP revenue model. For January through March 2015, in-app purchase generated 55% of all developer revenue.
If your Windows Phone apps generate revenue from in-app advertising, we encourage you to implement Windows ad mediation, a simple solution to help you manage multiple in-app advertising SDKs while increasing ad fill rate and revenue. In our testing, ad mediation delivered a fill rate of over 95% as well as a revenue increase of up to 200%. Of course, results vary by market and app.
For Further Analysis
We recommend taking some time to browse through the app catalog in the categories you want to develop for, and analyze the top apps in each category to see what makes these apps successful based on the trends data provided.
If you haven’t already, we encourage you to begin developing content for 8.1. This is the dominant operating system for app users, and the code is designed to easily transfer over to Windows 10. We also recommend registering for our Windows Insider Program to gain early insight to app developer tools. Also, be sure to follow the Building Apps for Windows blog posts during the Build 2015 conference for information on exciting things to come in the Windows Store.
We hope this data helps inform your decisions on investment areas for new apps and app updates. Please share your ideas for data that could help you make investment decisions to help us plan the next installment.