

The final versions for the upcoming release are available in the Insider builds from Build 16226, along with the corresponding SDK.
At a high level, these APIs allow an app to:
- Enumerate a list of running apps, including UWP apps, Win32 apps, system services and so on.
- For each app, get process-specific metrics on:
- Memory usage (private commit and working set).
- CPU usage.
- Disk reads and writes.
- For each UWP app, get additional metrics on:
- Memory usage (including shared commit) equivalent to the Windows.System.MemoryManager report previously available to an app for its own usage.
- State info: running, suspending, suspended, not running.
- Energy quota info: under or over.
- Enumerate a list of any background tasks that are active for the app, including name, trigger type and entry point.
- Enumerate all the processes for the app (using an enhancement to the existing Windows.System.Diagnostics.ProcessDiagnosticInfo class that was previously restricted to an app for its own usage).
The API has a simple hierarchical structure:
- The AppDiagnosticInfo type represents a single app. Callers would normally request either a single AppDiagnosticInfo for the app you’re interested in or a list of AppDiagnosticInfos if you’re interested in multiple apps.
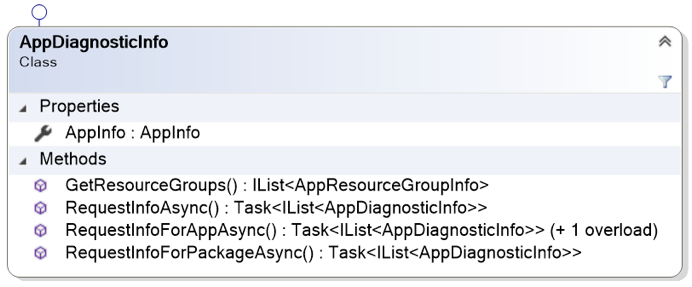
- Once you’ve gotten hold of an AppDiagnosticInfo for an app you’re interested in, you’d call GetResourceGroups to get a list of AppResourceGroupInfo objects. Each AppResourceGroupInfo corresponds to a resource group. An app can define resource groups in its manifest as a way to organize its components (foreground app, background tasks) into groups for resource management purposes. If you don’t define any explicit resource groups, the system will provide at least one (for the foreground app) plus potentially more (if you have out-of-proc background tasks, for example).

- From there, you’d call any of the AppResourceGroupInfo methods to get snapshot reports of memory usage, execution and energy quota state, and the app’s running background tasks (if any) via the AppResourceGroupMemoryReport, AppResourceGroupStateReport and AppResourceGroupBackgroundTaskReport classes.

- And finally, each group exposes a list of ProcessDiagnosticInfo objects.
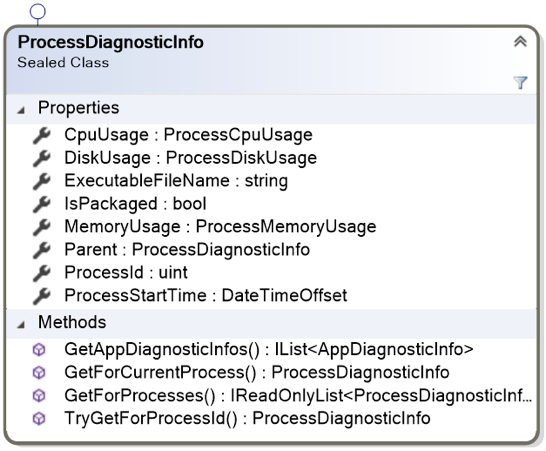
As you can see from the class diagrams, the AppDiagnosticInfo and ProcessDiagnosticInfo each have a link to the other. This means you can get all the rich process-specific info for any running process and get the UWP-specific info for any process related to a UWP app (including Desktop Bridge apps).
These APIs are intended to support app developers who either need more diagnostic support during their own app development and testing, or who want to build a general-purpose diagnostic app and publish it in the Windows Store. Exposing information about other apps raises potential privacy concerns, so if your app uses these APIs, you’ll need to declare the appDiagnostics capability in your manifest, along with the corresponding namespace declaration:
[code lang=”xml”]
<Package
xmlns:rescap="http://schemas.microsoft.com/appx/manifest/foundation/windows10/restrictedcapabilities"
IgnorableNamespaces="uap mp rescap">
…
<Capabilities>
<rescap:Capability Name="appDiagnostics" />
</Capabilities>
</Package>
[/code]
This is a restricted capability: If you submit an app with this capability to the Windows Store, this will trigger closer scrutiny. The app must be in the Developer Tools category, and we will examine your app to make sure that it is indeed a developer tool before approving the submission.
At run time, the capability also triggers a user-consent prompt the first time any of the diagnostic APIs are called:

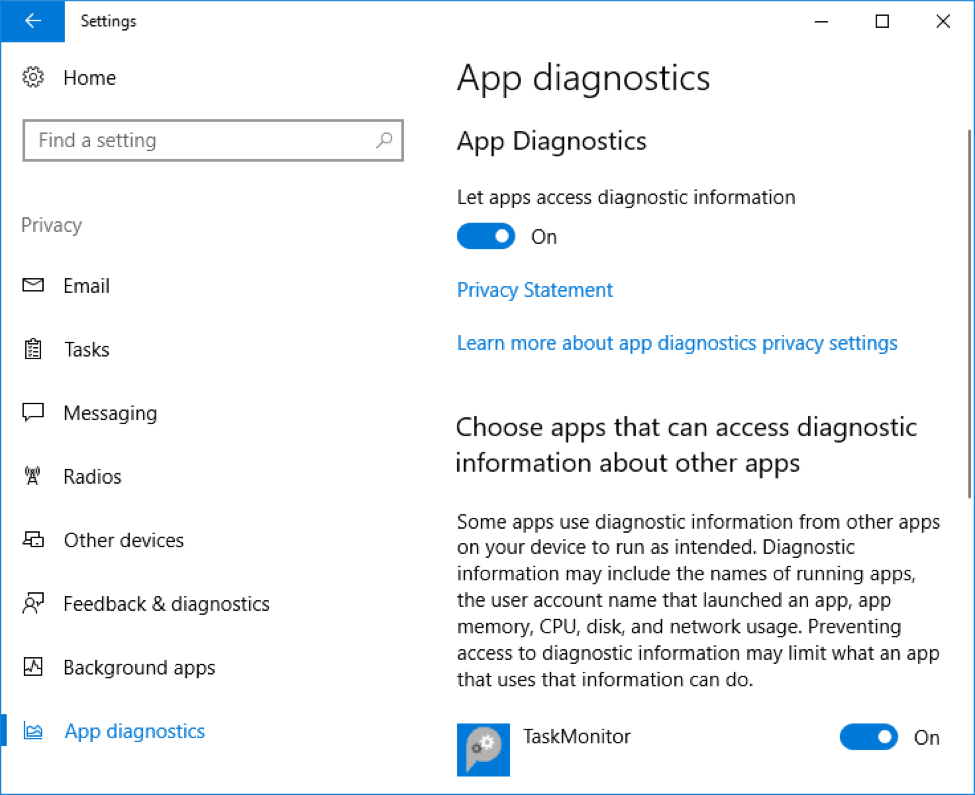
The user is always in control: If permission is denied, then the APIs will only return information about the current app. The prompt is only shown on first use, but the user can change his or her mind any time via the privacy pages in Settings. All apps that use the APIs will be listed here, and the user can toggle permission either globally or on a per-app basis:
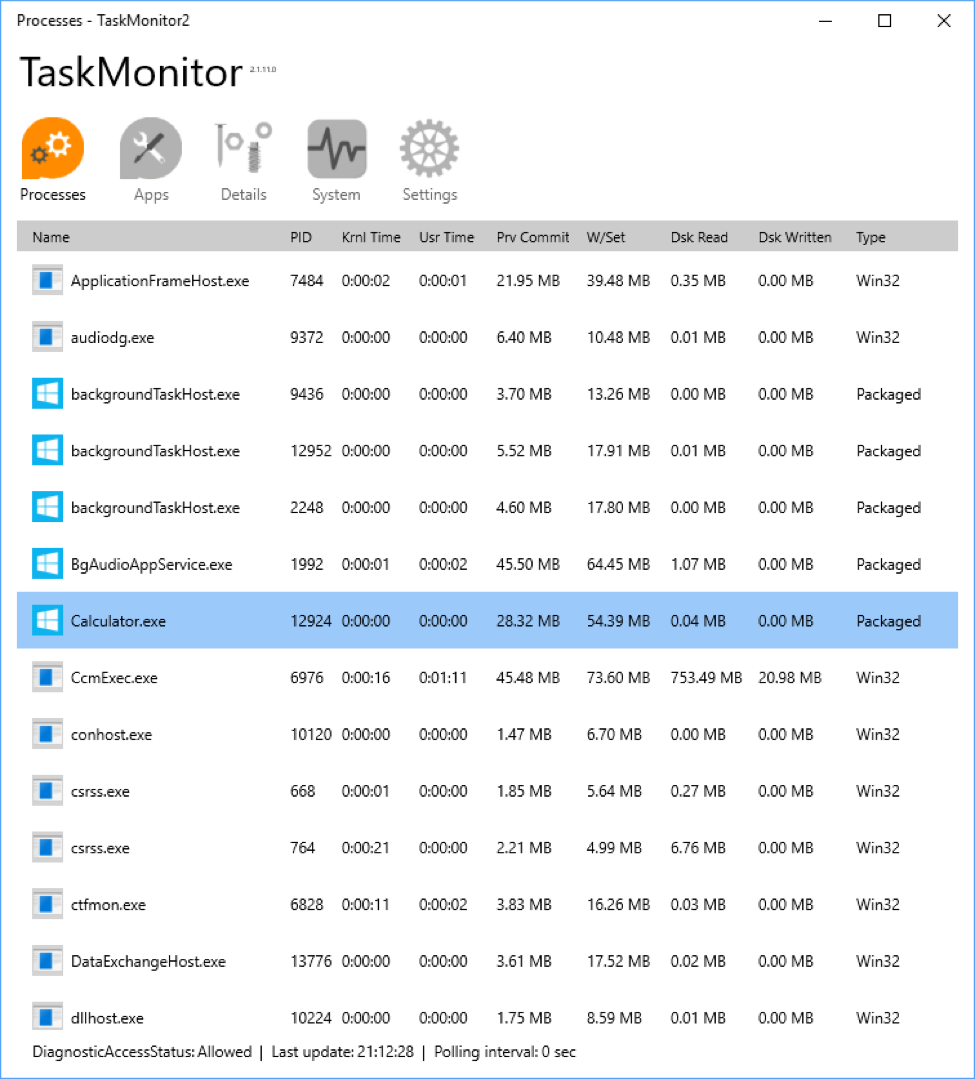
Given the richness of the APIs, it’s not too much of a stretch to envisage creating a UWP version of Task Manager. There are a few features that we can’t implement just yet (terminating apps and controlling system services, for example), but certainly most of the data reporting is perfectly possible with the new APIs:
The first thing to do is to request permission to access diagnostics for other apps using AppDiagnosticInfo.RequestAccessAsync. The result could be Denied, Limited (which means you can only get information for the current app package) or Allowed.
[code lang=”csharp”]
DiagnosticAccessStatus diagnosticAccessStatus =
await AppDiagnosticInfo.RequestAccessAsync();
switch (diagnosticAccessStatus)
{
case DiagnosticAccessStatus.Allowed:
Debug.WriteLine("We can get diagnostics for all apps.");
break;
case DiagnosticAccessStatus.Limited:
Debug.WriteLine("We can only get diagnostics for this app package.");
break;
}
[/code]
Then, to emulate Task Manager, you’d start with a list of the ProcessDiagnosticInfo objects for all running processes.
[code lang=”csharp”]
IReadOnlyList<ProcessDiagnosticInfo> processes = ProcessDiagnosticInfo.GetForProcesses();
[/code]
For each running process, you can extract the top-level process-specific information such as the ExecutableFileName and the ProcessId. You can also get the more detailed process information from each of the three reports for CpuUsage, MemoryUsage and DiskUsage.
[code lang=”csharp”]
if (processes != null)
{
foreach (ProcessDiagnosticInfo process in processes)
{
string exeName = process.ExecutableFileName;
string pid = process.ProcessId.ToString();
ProcessCpuUsageReport cpuReport = process.CpuUsage.GetReport();
TimeSpan userCpu = cpuReport.UserTime;
TimeSpan kernelCpu = cpuReport.KernelTime;
ProcessMemoryUsageReport memReport = process.MemoryUsage.GetReport();
ulong npp = memReport.NonPagedPoolSizeInBytes;
ulong pp = memReport.PagedPoolSizeInBytes;
ulong peakNpp = memReport.PeakNonPagedPoolSizeInBytes;
//…etc
ProcessDiskUsageReport diskReport = process.DiskUsage.GetReport();
long bytesRead = diskReport.BytesReadCount;
long bytesWritten = diskReport.BytesWrittenCount;
//…etc
}
}
[/code]
For any process associated with a UWP app, the IsPackaged property is true. So, for each of these, you can get from the ProcessDiagnosticInfo to the AppDiagnosticInfo. It might seem strange that we can get AppDiagnosticInfos (plural) from a process – but this is to allow for the possibility that a single process is associated with more than one app. That’s an extremely uncommon scenario, but it is possible in the case of VoIP apps where two or more apps in the same package can share a component running in a separate process at run time. In almost all cases, though, there will only be one AppDiagnosticInfo per process.
[code lang=”csharp”]
if (process.IsPackaged)
{
IList<AppDiagnosticInfo> diagnosticInfos = process.GetAppDiagnosticInfos();
if (diagnosticInfos != null && diagnosticInfos.Count > 0)
{
AppDiagnosticInfo diagnosticInfo = diagnosticInfos.FirstOrDefault();
if (diagnosticInfo != null)
{
IList<AppResourceGroupInfo> groups = diagnosticInfo.GetResourceGroups();
if (groups != null && groups.Count > 0)
{
[/code]
From the AppDiagnosticInfo, you can walk down the hierarchy and get a collection of AppResourceGroupInfos. Then, for each AppResourceGroupInfo, you can get the UWP-specific state and memory information:
[code lang=”csharp”]
AppResourceGroupInfo group = groups.FirstOrDefault();
if (group != null)
{
string name = diagnosticInfo.AppInfo.DisplayInfo.DisplayName;
string description = diagnosticInfo.AppInfo.DisplayInfo.Description;
BitmapImage bitmapImage = await GetLogoAsync(diagnosticInfo);
AppResourceGroupStateReport stateReport= group.GetStateReport();
if (stateReport != null)
{
string executionStatus = stateReport.ExecutionState.ToString();
string energyStatus = stateReport.EnergyQuotaState.ToString();
}
AppResourceGroupMemoryReport memoryReport = group.GetMemoryReport();
if (memoryReport != null)
{
AppMemoryUsageLevel level = memoryReport.CommitUsageLevel;
ulong limit = memoryReport.CommitUsageLimit;
ulong totalCommit = memoryReport.TotalCommitUsage;
ulong privateCommit = memoryReport.PrivateCommitUsage;
ulong sharedCommit = totalCommit – privateCommit;
}
}
[/code]
Note: to get the packaged logo from the app, there’s a little extra work. You call GetLogo from the AppDisplayInfo to return the data as a stream; if there are multiple logos available, this will return the largest one that is within the specified size.
[code lang=”csharp”]
private async Task<BitmapImage> GetLogoAsync(AppDiagnosticInfo app)
{
RandomAccessStreamReference stream =
app.AppInfo.DisplayInfo.GetLogo(new Size(64, 64));
IRandomAccessStreamWithContentType content = await stream.OpenReadAsync();
BitmapImage bitmapImage = new BitmapImage();
await bitmapImage.SetSourceAsync(content);
return bitmapImage;
}
[/code]
Once you’ve collected all the various detailed metrics you’re interested in, it’s a simple matter to populate your viewmodel for data-binding purposes, to perform data analytics or to do whatever other processing you might want.
In a later post, we’ll look at how you can integrate the diagnostic APIs with existing developer tools such as Visual Studio and Appium.