

There isn’t much you can’t do with web technologies nowadays. The web platform has evolved so much that such diverse things as animating elements, playing or recording media, accessing files or storage, intercepting network requests and accessing the cache, making complex CSS layouts, or writing native code are all possible today.
With that much to learn about and use, web developers need a complete suite of tools they can rely on.
Fortunately, Microsoft Edge comes with development tools that make it possible for web developers to be productive with the web features and APIs. No matter what you are doing, there is most likely a dedicated tool that can help you.
The flip side however, is that DevTools tend to be quite complicated. They contain over 30 different tools, and the user interface has grown over time to accommodate them. What’s more, new features are being added all the time in response to the feedback we receive from users.
In this post, we’ll introduce you to new features in the Microsoft Edge DevTools which help make the tools more approachable and personalizable, so you can begin to tackle the challenge of having so many different tools at your disposal. You can also learn more about these features in the video below.

DevTools are rapidly evolving across browsers – to stay up to date with the latest in other browsers, check out my article in Smashing Magazine covering new DevTools features in Microsoft Edge, Google Chrome, Mozilla Firefox, and Safari.
Opening, closing and moving tools
While the DevTools have around 30 separate tools, it’s unlikely that you’ll need access to more than a handful of them at the same time—let alone 30. So having a way to easily open tools when you need them, and close them when you don’t is very important.
At the same time, there might be tools you’ve never used before which could be very handy. If those are closed by default, you might never discover them at all.
We added three small, but very powerful, DevTools features to address this.
Closing tools
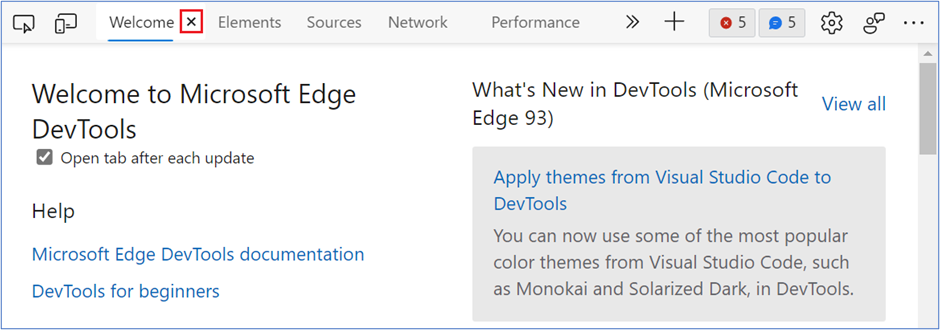
Tabs in Microsoft Edge DevTools now have a close button that can be used to hide the ones you don’t need anymore. You can therefore keep a clean and simple user interface, and only have the tools you need right now readily available.
Note that a few tools do not have a close button: Elements, Console and Sources. Those tools are used much more than all the other ones. Web developers need them at all times, and closing them doesn’t make much sense.
Opening tools
There is now a + (plus) button at the end of the tab bar to open any tool not already open.
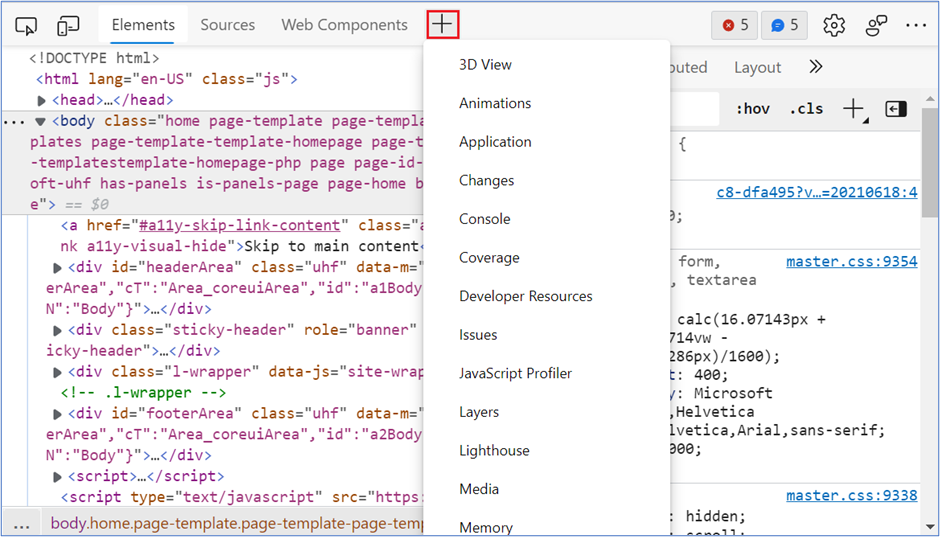
Previously, in order to discover all the available tool, you had to go in the main menu (…), and then select More tools, or know how to use the command menu to access tools quickly. The + button makes discovering and accessing other tools much easier.
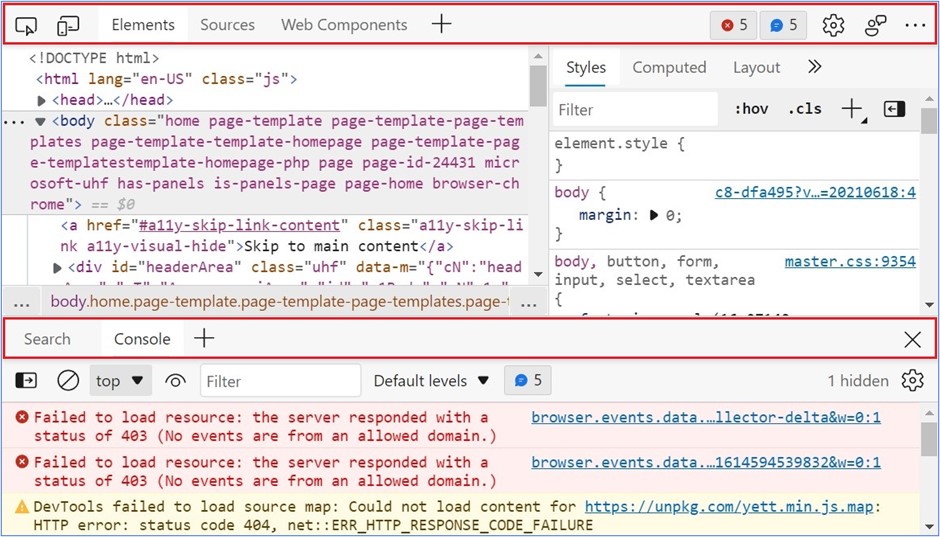
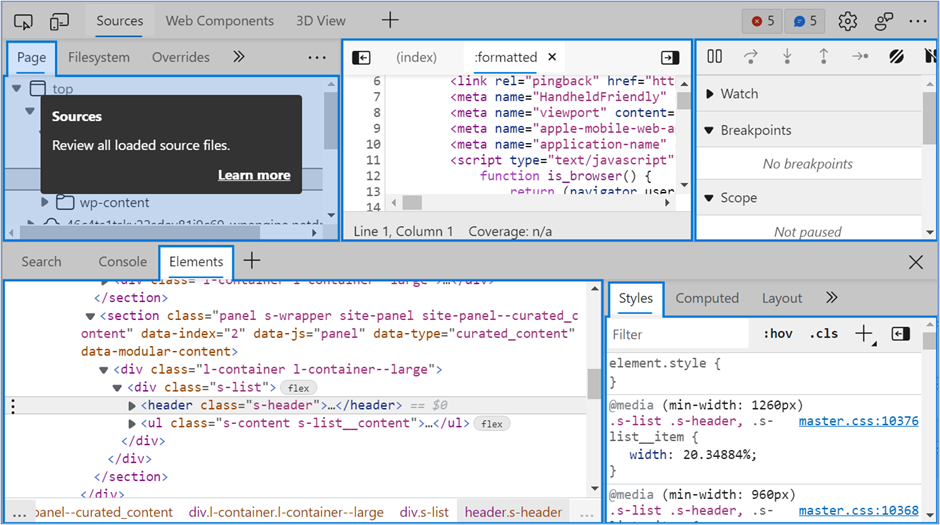
There can be two tab bars in DevTools: one at the top, which is always visible and is where the Elements and Sources panels usually are, and one at the bottom, the Drawer, which can be toggled by pressing Esc on your keyboard. The Console usually lives in the drawer. Both of these tab bars have the + button, so you can open new tools in any of these 2 locations.
Moving tools
Having the drawer open can be very useful when debugging something that requires more than one tool at the same time.
For example, you may want to have both the Sources and Network panels opened at the same time to make sure the right HTTP requests are sent when step debugging some JavaScript code. Or you may want to have both the Elements and 3D View panels opened side by side to debug a z-index issue with an element.
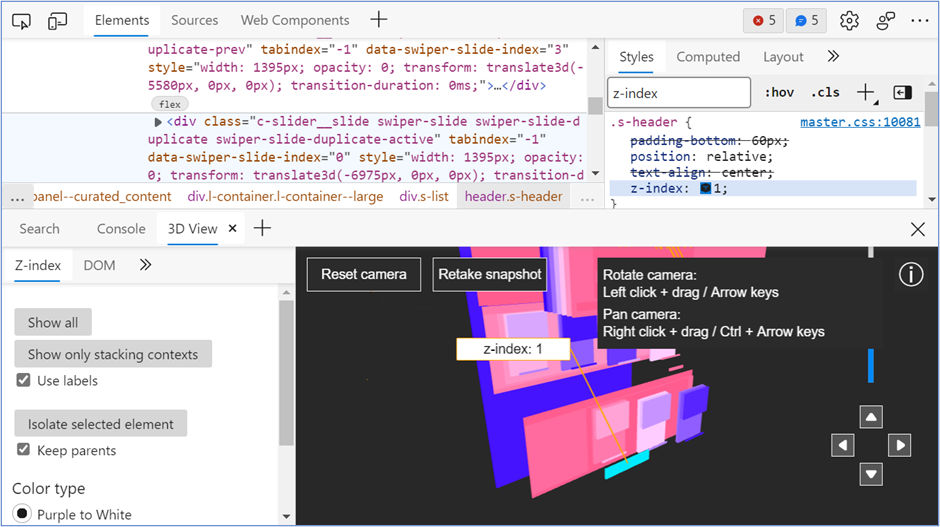
With Microsoft Edge DevTools, you can now move tools between the main area and the drawer by opening the contextual menu (right-click) on the tab you want to move and selecting Move to bottom or Move to top.
Note that if you select the + button in the drawer and choose a tool from the list that is already opened in the main area, then this tool will be moved to the drawer. This is another good way of moving tools around.
Learning about the tools, from within the tools
The + button is great to easily discover new tools you might not have used before. But sometimes, the user interface of a tool can be overwhelming at first glance. It helps to have some documentation available. The Microsoft Edge DevTools documentation can help you there, but is often not at your fingertips when you’re mid-task.
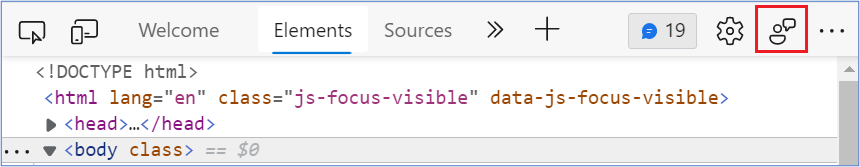
Recently, we added a feature to make contextual learning about a new tool even easier: DevTools Tooltips. The DevTools Tooltips is an overlay that covers the tools and provides contextual documentation about them, with links to learn more.
You can enable the DevTools Tooltips in 3 different ways:
- Go to the Customize and control DevTools button (…) > Help > Toggle the DevTools Tooltips.
- You can also use the Ctrl+Shift+H keyboard shortcut (Cmd+Shift+H on Mac).
- Or use the command menu, and type “tooltips”.
Once enabled, just move your mouse over the highlighted areas to display an information tooltip about this specific area of the tools (you can also use the Tab key to navigate through the tooltips). Some of the tooltips even contain links to the documentation website to find out even more.
Note that you can also go to other panels while the DevTools Tooltips are active. This way, you can navigate DevTools and keep learning about new things without having to turn the feature off and on again every time.
Changing the language
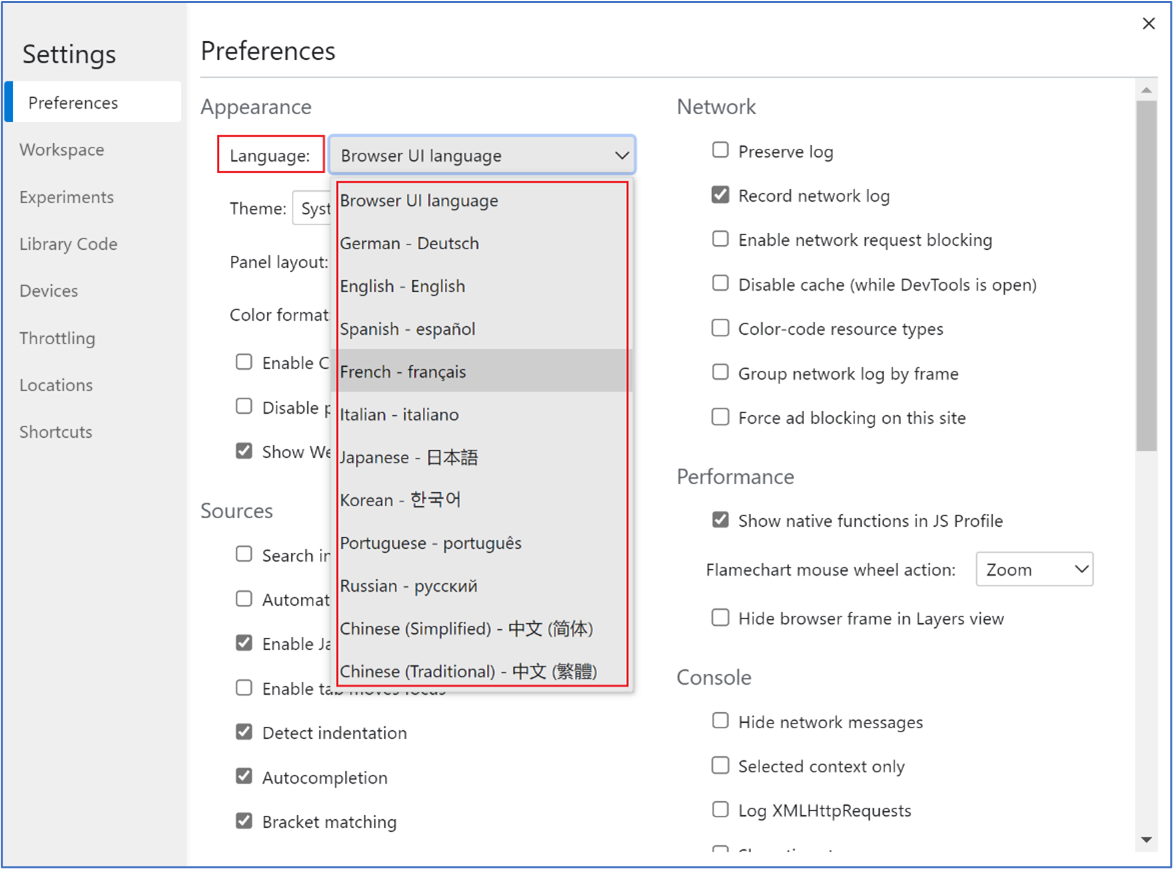
We know that developers can be more productive when their tools match their language preference. Additionally, other Microsoft developer products, including VS Code, can be used in other languages. This is why we made DevTools available in 11 different languages.
By default, DevTools matches the language you choose for the browser UI, but you can independently set it to any of these other languages.
| English | German – Deutsch |
| Chinese (Simplified) – 中文(简体)(简体) | Chinese (Traditional) – 中文(繁體)(繁體) |
| French – Français | Spanish – Español |
| Portuguese – Português | Japanese – 日本語 |
| Italian – Italiano | Korean – 한국어 |
| Russian – Pусский |
To change the language, navigate to the DevTools settings (using the F1 shortcut or clicking the gear icon in the toolbar) and choose from the Language dropdown list.
After reloading DevTools, its user interface will appear in the language of your choice, making it easier to use the tools. Here is what it looks like in French:

This works great with the DevTools Tooltips feature too, since the contextual documentation is translated as well, as shown in Russian below.

Since we announced the experimental release of the localized DevTools feature in 2020, we’ve continued collaborating with the Lighthouse and Chrome teams at Google through the Chromium project, and the feature is now not only available to all Microsoft Edge users, but also to anyone using DevTools in a Chromium-based browser.
Customizing your color theme
If you use Visual Studio Code (or other text editors and IDEs for that matter), you likely have customized its color theme to something visually pleasing and comfortable to work with for long periods of time.
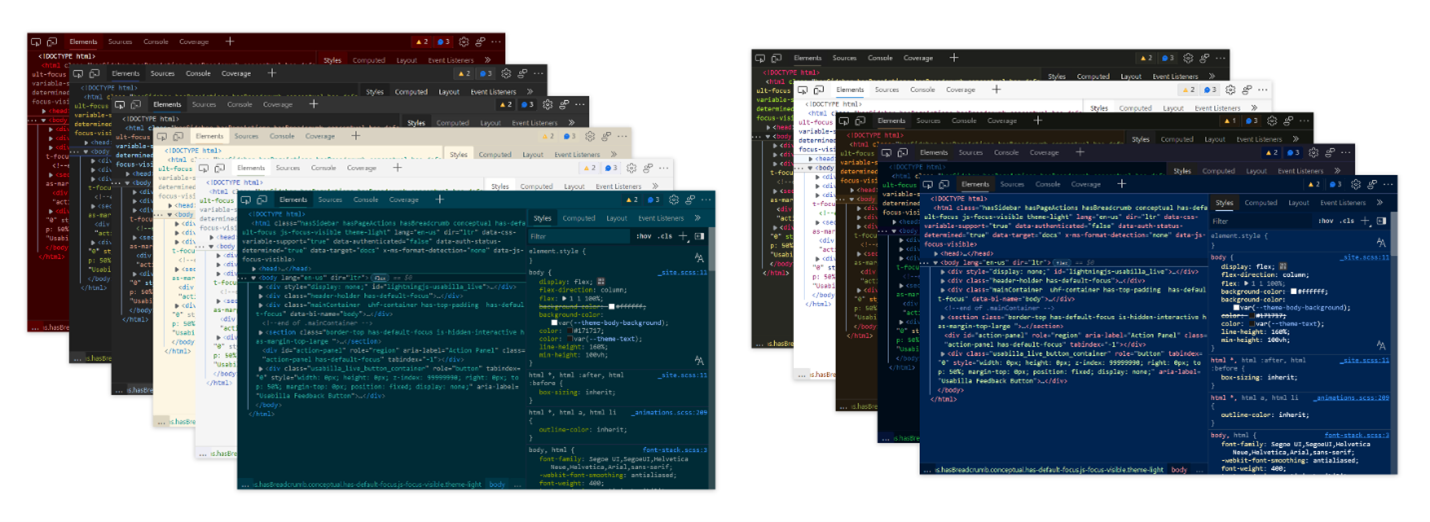
Until now, the DevTools color theme could only be customized by choosing between its dark or light themes. However now, there are 9 new color themes to choose from. These are the same as the Visual Studio Code pre-installed ones and should therefore be familiar.
Here is the entire list of themes in Microsoft Edge DevTools now:
- Existing themes:
- Light+
- Dark+
- Chromium Light
- Chromium Dark
- New themes:
- Quiet Light
- Solarized Light
- Solarized Dark
- Abyss
- Kimbie Dark
- Monokai
- Monokai Dimmed
- Red
- Tomorrow Night Blue
To choose a new theme, you can go to the Settings (the gear icon in the toolbar) and use the Theme dropdown. You can also use the command menu and type “theme” to see the entire list of available color themes.
Note that if you use the Microsoft Edge Tools for VS Code extension, you might have seen that DevTools isn’t always displayed with the same color theme as the VS Code user interface itself.
Now, thanks to the new color themes in DevTools, this will no longer happen. As of Microsoft Edge 95, the DevTools UI, embedded in VS Code will match the selected color theme.
If you don’t know about this extension, learn more about it here.
Feedback
User feedback is how we drive priorities for the work happening on Microsoft Edge DevTools. If you have any questions or feedback about these features or others, please send us a few words and screenshots using the the feedback button in DevTools.
Feel free to also ask questions to our team on Twitter by mentioning the @EdgeDevTools account.
– Patrick Brosset, Senior Program Manager, Microsoft Edge