What is TTD?
Wouldn’t it be great to go back in time and fix a problem? We can’t help you go back in time to fix poor life choices, but we can help you go back in time to fix code problems.
Time Travel Debugging (TTD) is a reverse debugging solution that allows you to record the execution of an app or process, replay it both forwards and backwards and use queries to search through the entire trace. Today’s debuggers typically allow you to start at a specific point in time and only go forward. TTD improves debugging since you can go back in time to better understand the conditions that lead up to the bug. You can also replay it multiple times to learn how best to fix the problem.
TTD is as easy as 1 – 2 – 3.
- Record: Record the app or process on the machine which can reproduce the bug. This creates a Trace file (.RUN extension) which has all of the information to reproduce the bug.
- Replay: Open the Trace file in WinDbg Preview and replay the code execution both forward and backward as many times as necessary to understand the problem.
- Analyze: Run queries & commands to identify common code issues and have full access to memory and locals to understand what is going on.
Getting Started
I know you are all excited and ready to start using TTD. Here are a few things you should know to get started.
- Install: You can use TTD by installing the WinDbg Preview (build 10.0.16365.1002 or greater) from the Store if you have Windows 10 Anniversary Update or newer at https://aka.ms/WinDbgPreview.
- Feedback: This is a preview release of TTD, so we are counting on your feedback as we continue to finish the product. We are using the Feedback Hub to help us prioritize what improvements to make. The Windows Insider website has a great overview on how to give good feedback https://insider.windows.com/en-us/how-to-feedback.
- Questions: We expect you will have some questions as you work with TTD. So feel free to post them on this blog or send them in the Feedback Hub and we will do our best to answer. We’ll be posting a TTD FAQ on our blog shortly.
- Documentation: We’ve got some initial documentation at https://docs.microsoft.com/en-us/windows-hardware/drivers/debugger/time-travel-debugging-overview and will be improving our content based upon customer feedback and usage. You can give us feedback or propose edits on the docs.microsoft.com documentation by hitting “Comments” or “Edit” on any page.
- Blogs: Watch for more in-depth TTD updates and tips in the future on our team’s blog https://blogs.msdn.microsoft.com/windbg.
How to use TTD
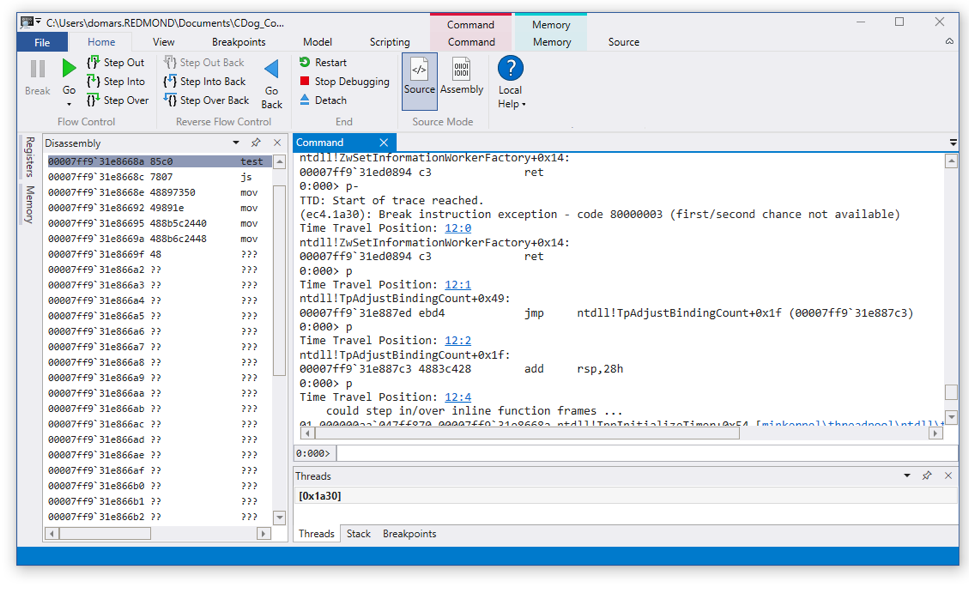
You use TTD directly in the WinDbg Preview app. We have added all of the key TTD features into WinDbg Preview to provide a familiar debugging experience, which makes it intuitive to go backwards and forwards in time during your debugging session.
Record a Trace
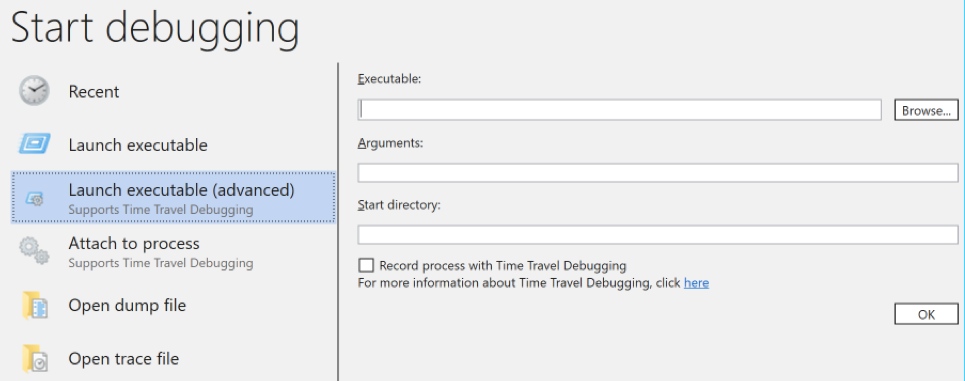
WinDbg Preview makes it easy to record a trace. Simply click File >> Start Debugging and point to the app or process. You will have an option to Record during attach and launch. See https://docs.microsoft.com/en-us/windows-hardware/drivers/debugger/time-travel-debugging-overview for more information.
Replay a Trace
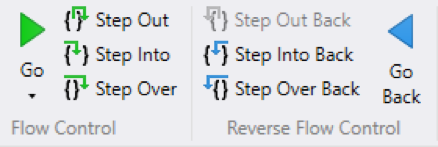
Once the Trace is complete, we automatically load and index the Trace for faster replay and memory lookups. Then simply use the WinDbg ribbon buttons or commands to step forwards and backwards through the code.
Basic TTD Commands
You can use the ribbon or enter the following TTD commands in WinDbg Preview. See https://docs.microsoft.com/en-us/windows-hardware/drivers/debugger/time-travel-debugging-overview for a complete list of TTD commands.
Final Thoughts
We are very excited to get TTD into the hands of our developers; but there are a few things to remember.
- TTD is a preview, so we will be regularly improving performance and features
- This only runs on Windows 10 since WinDbg Preview is a Store app
- See docs.microsoft.com documentation for TTD known issues and compatibility
Welcome to the world of time travel. Our goal is to improve the lives of developers by making debugging easier to increase product quality. Please send us feedback and feature requests in the Feedback Hub to let us know how we are doing!


