Looking to take control of your PC? Looking to optimize your PC’s performance? The Task Manager is a great tool for these tasks, and it’s always just a couple clicks away. For Windows 8, the Task Manager got a major overhaul that includes a lot of great new features. In this post I’ll walk through some of these new features and enhancements, and I’ll also show you some lesser-known tips and tricks. In the included video (see bottom of post) I’ll show a whole bunch of cool tricks and time saving features in the Windows 8 Task Manager, be sure to watch it!
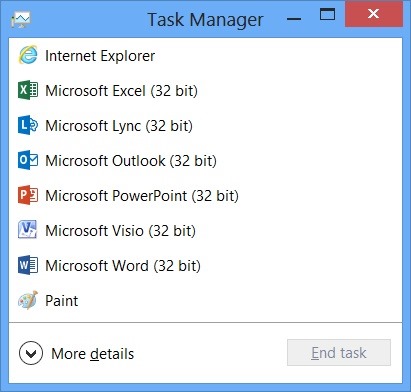
When you launch the Windows 8 Task Manager, by default you’ll see a simple view where you can manage running applications:
Windows 8 Task Manager – Default View
Tip: There are a few quick ways to launch the Task Manager on Windows 8:
- Press Ctrl+Shift+Esc
- Press Ctrl+Alt+Delete, select Task Manager
- From the Start Screen, type “Task” (Task Manager will show up in apps list) then hit enter
- From the desktop, right click on the task bar and select “Task Manager” from the context menu
- Launch the Quick Link menu (Win+X) and select “Task Manager”
The default view shown above is really just the “tip of the iceberg” in terms of functionality. By clicking on the “More Details” down arrow to reveal the expanded mode, you’ll see the full set of capabilities in the Windows 8 Task Manager.
Old vs New
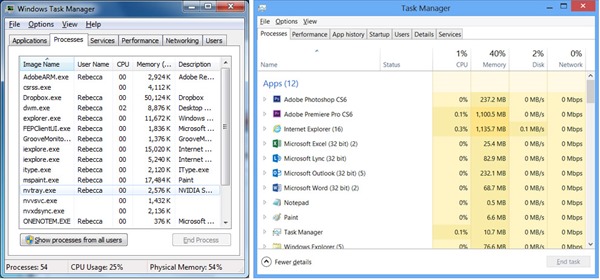
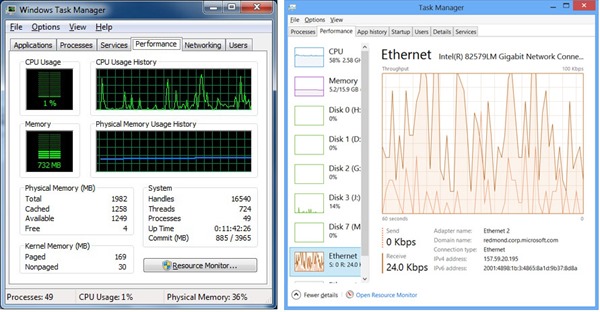
Here you can see the Windows 7 Task Manager (left) right next to the updated Windows 8 Task Manager in expanded mode:
Windows 7 Task Manager (left) and Windows 8 Task Manager in expanded view (right) – (Click/Tap to enlarge)
You can see right off a few big changes with the tab layout:
- Processes tab has been completely redesigned
- Performance and Networking tabs have been merged
- New tabs: App History, Startup
Now that you can visualize how the Task Manager has changed in Windows 8 let’s walk through some of the cool new features.
Processes Tab
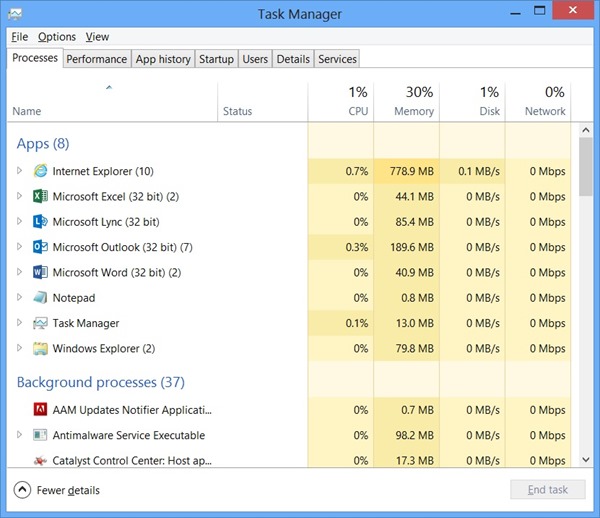
The Processes tab is shown by default when the Windows 8 Task Manager is launched. It’s the place where you can manage running apps and services, and also monitor high-level performance stats.
Windows 8 Task Manager: Processes Tab (default view when expanded) – (Click/Tap to enlarge)
On the Processes tab, there are two primary components of the UI: Running processes (left side) and the heat map (right side). In the Windows 8 Task Manager, running processes are sorted by apps, non-Windows background processes, and Windows processes. Apps are sorted out at the top, making it easy to find, monitor, and manage apps without having to scan all processes and scroll through many items as you had to in prior versions of Task Manager.
The heat map (shown in varying shades of yellow and orange above) is a visualization of the resource utilization for processes which makes it easy to pinpoint where high resource utilization is taking place.
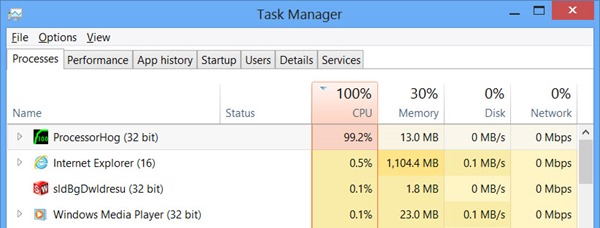
The heat map is color-coded with low resource utilization shown in pale yellow, with darker shades of yellow and orange representing progressively greater resource utilization. If resource utilization has reached a critical level, the value will be shown with a red background as seen here:
The Heat Map shows extreme resource utilization in red – (Click/Tap to enlarge)
The misbehaving app here (an old tool I wrote called “Processor Hog”) is using 99.2% of the capacity of the 24 logical cores on my dual-Xeon HP Z820. There are two visual cues that alert us to what’s going on: the CPU utilization for ProcessorHog.exe has turned red, and the column label for CPU has also been highlighted in red. This makes it easy to see when your system is under heavy load, and which resource(s) are tapped out.
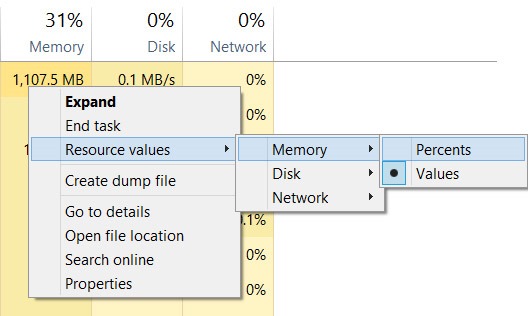
Tip: You can change the resource utilization units for memory, disk, and network from raw values to % by right clicking on the heat map:
Once you get used to the new processes tab in the Windows 8 Task Manager, it’s hard to imagine living without it.
Performance Tab
The Performance tab got a major overhaul for Windows 8, and it’s got some really powerful new capabilities!
Performance views in Task Manager: Windows 7 (left) and Windows 8 (right) – (Click/Tap to enlarge)
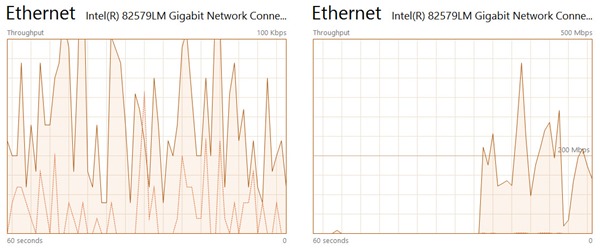
You can see in this side-by-side comparison how the performance view in the Task Manager really was reimagined. On the left-hand side of the new performance view live mini-graph views are shown for each performance metric, and on the right-hand side you see a detail graph for the selected metric. Each performance category has a unique information view at the bottom that shows relevant statistics for the performance category currently selected. One of the great enhancements in these new graph views is how the bounds of the graphs are dynamically scaled to current utilization. In the side by side comparison view below, the upper bound of the left-hand network utilization scale is 100 kbps. During a download of several large files from a network share that I performed, the scale automatically changed to 500 Mbps as you can see here on the right-hand side:
Network utilization graph while idle (left) and during bulk network file copy (right) – (Click/Tap to enlarge)
After the file copy finished and network utilization stayed low for a period of time, the scale reverted back to 100 kbps. This new dynamic graph capability makes it easy to see what’s going on even when utilization figures change drastically.
Another capability of the performance graphs in the Windows 8 Task Manager is the ability to select multiple views for CPU utilization:
CPU performance graphs from left: overall utilization, NUMA nodes, logical processors – (Click/Tap to enlarge)
To switch between these CPU utilization views, right-click on the graph view, select “Change Graph To” and pick the graph option you want to see.
Tip: If you double click on the graph view, you can toggle a summary view where only the graph is displayed and can easily be floated over other windows. If you double click the summary view you can return to the full view.
Tip: With the memory graph displayed, if you hover over the “Slots used” label below the graph you’ll get a summary of slots used by number, and the speed of the memory in each slot.
If you haven’t already, I suggest you spend some time exploring the capabilities in the Windows 8 Task Manager performance tab, there’s a lot of information available in this view!
App History Tab
The App History tab shows historical resource utilization metrics for apps. By default, the view shows only Windows Store App resource utilization.
Tip: On the app history tab, you can go to “Options à show history for all processes” to see historical resource utilization for all apps.
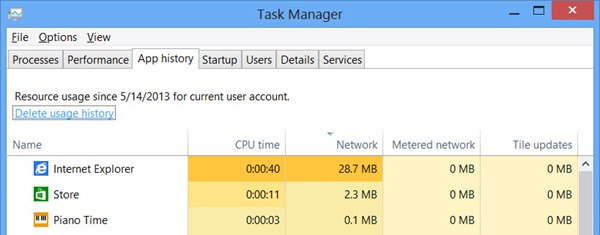
To show how this feature works, I cleared my usage data (default is 30 day rolling window) by clicking the “Delete usage history” link and then performed some everyday tasks: installing apps from the store and browsing the web.
App history sorted by network utilization – (Click/Tap to enlarge)
Following this exercise, I took the screen capture shown above. By sorting on network, I was able to quickly compare network bandwidth utilization for recently used apps. By right clicking on an app in the list and selecting “switch to” you can quickly activate the app and continue using it.
Startup Tab
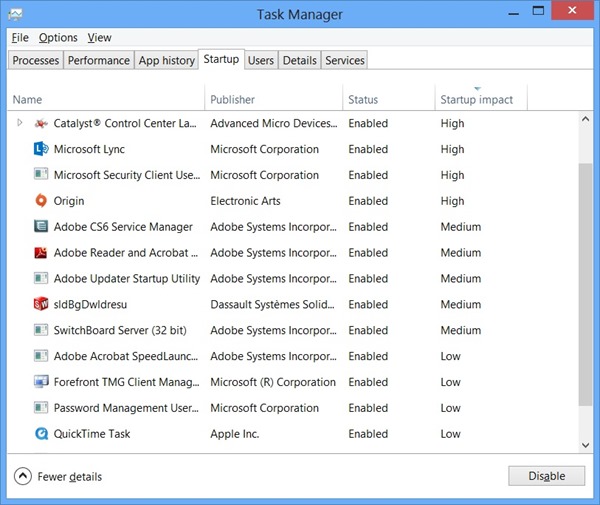
Is startup performance important to you? If so you’ll want to check out the Startup tab in the Windows 8 Task Manager. From this view you can see a summary of startup performance, and tune startup behavior all in one place.
Startup tab in the Windows 8 Task Manager – (Click/Tap to enlarge)
In this view I’ve sorted by startup impact. When this sorting is used, it’s easy to see high impact and medium impact startup path components grouped together. When you right click on one of the items you can easily disable the item which removes it from the active startup path. Using the startup tab in the Windows 8 Task Manager is a great way to optimize your PC’s startup performance.
Tip: On the startup tab you can activate more columns by right clicking the column header that are not shown by default including startup type, disk I/O at startup, CPU at startup, running now, disabled time, and command line
Details Tab
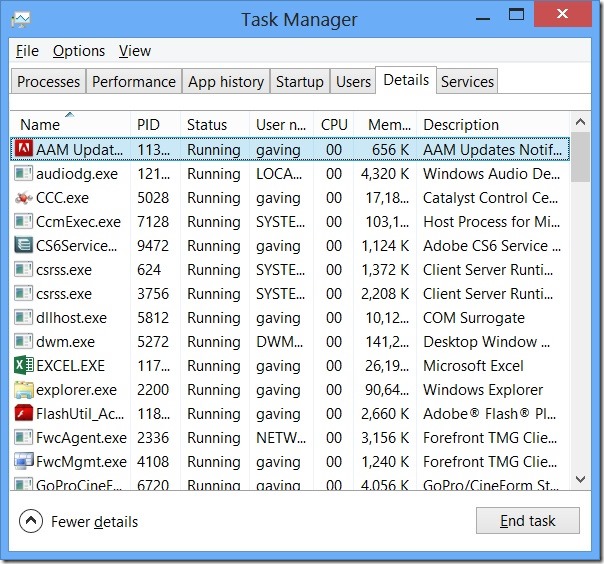
The details tab in the Windows 8 Task Manager looks a lot like the processes tab in the Windows 7 Task Manager.
Windows 8 Task Manager details tab – (Click/Tap to enlarge)
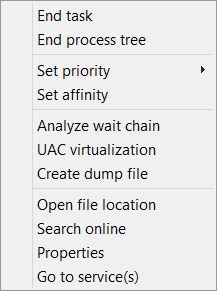
One of the interesting new capabilities in the details tab shows up when you right click on an item:
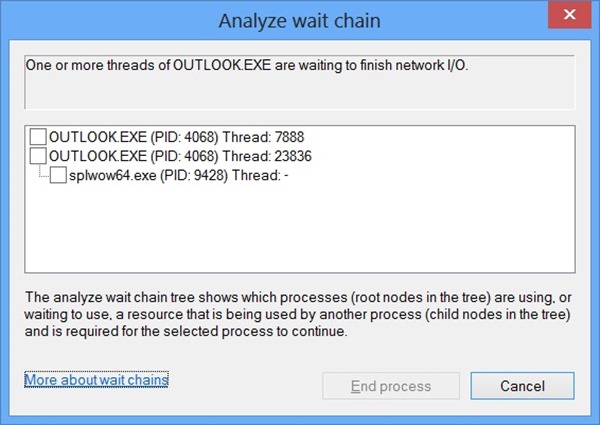
In the middle of the context menu you’ll see a new option called “Analyze wait chain”. This is a great capability that allows you to easily determine if a non-responsive application is waiting on another process as seen here:
Analyze wait chain dialog in the Windows 8 Task Manager – (Click/Tap to enlarge)
In this scenario, I printed from Outlook to an application and then invoked the analyze wait chain dialog while Outlook was waiting on the target application to complete the printing process. Had the target application hung, I could have terminated the target application from this dialog. This is a great capability because it allows you to avoid terminating dependent applications (Outlook in this case) in some circumstances.
The details tab in the Windows 8 Task Manager also supports many new column options so that you can view more information about running processes.
Services Tab
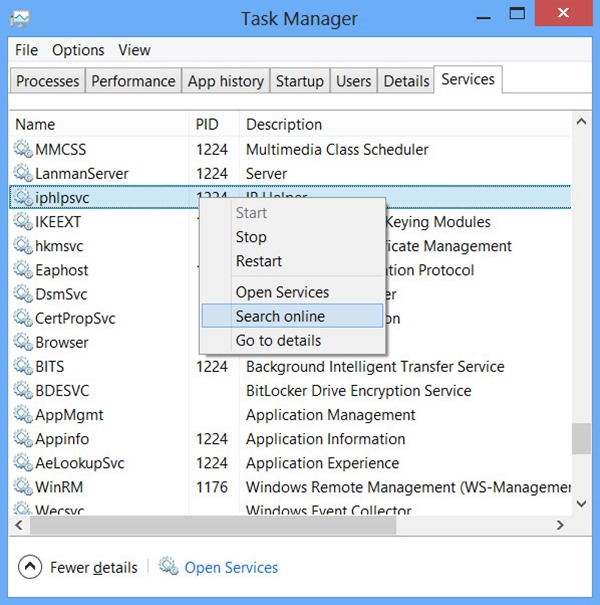
The services tab in the Windows 8 Task Manager is a lot like the services tab in the Windows 7 Task Manager. One notable improvement is the ability to right click on a service and easily search for information on the internet related to the service. Suppose you want to find out more about the “iphlpsvc” service. Before Windows 8 I would open a search window, manually type in the name of the service, and then sift through the results. Now this information is just a right-click away:
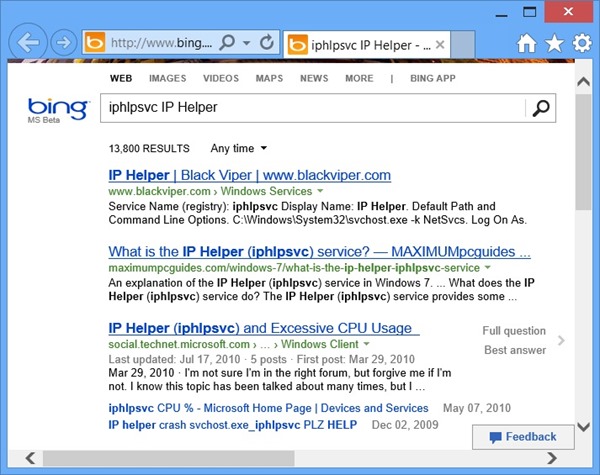
Clicking “Search online” opens a new search window in your default browser using your default search engine with search results for the service in question:
I like these kinds of time saving capabilities!
Tip: Search online is supported for certain items on the processes tab, startup tab, details tab, and services tab.
Want to see more tips, tricks, and new features in the Windows 8 Task Manager? Check out this video walkthrough I created:
Have tricks and tips that you’d like to share about the Windows 8 Task Manager? Please leave a comment!
Find me on twitter! @GavinGear

