Wondering what your GPU is doing? Curious how much GPU capability you’re using? Do you want to know practically every detail about your GPU? You may want to try the free Windows-exclusive tool from TechPowerUp called GPU-Z. I’ve been using this tool for a while now to prepare data for some of the blog posts published here, and have found it quite useful for other tasks as well. You don’t even need to install GPU-Z, you just download and run the executable. This portability makes it easy to run from a USB stick on multiple machines quickly and easily.
Here are some of the features offered by GPU-Z:
- Support for NVIDA, AMD/ATI and Intel GPUs
- Multi-GPU support (select from dropdown, shows one GPU at a time)
- Extensive info-view shows many GPU metrics
- Real-time monitoring of GPU statistics/data
- Logging to excel-compatible file (CSV)
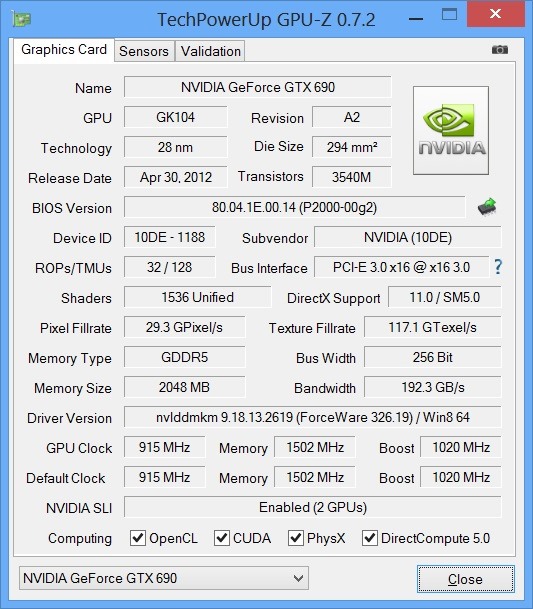
The default view is the “Graphics Card” tab. Here’s what’s shown for my NVIDIA GeForce GTX 690:
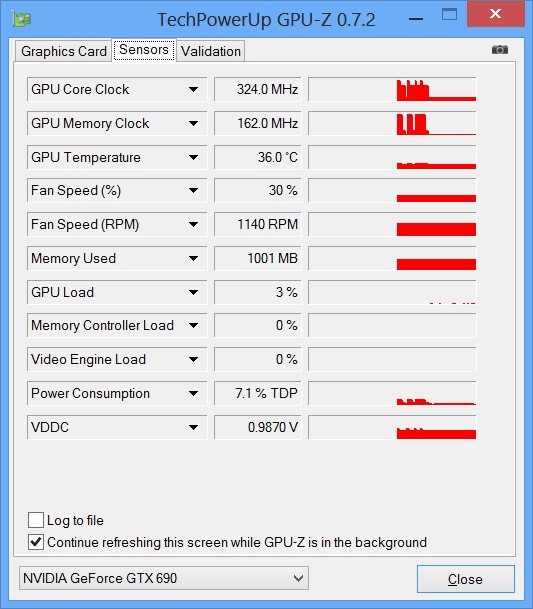
It’s amazing how much information you can see about your GPU from this view! Switching over to the “Sensors” view enables you to view real-time GPU data including clock speeds, GPU utilization, and more:
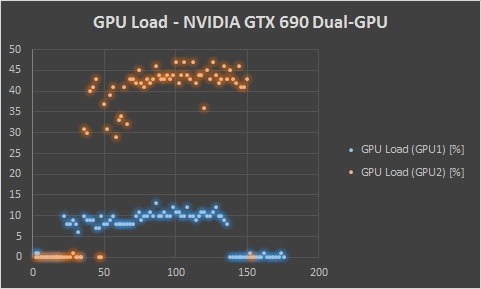
In combination with the graphing tools in Excel 2013, I was able to quickly assemble a multi-GPU utilization graph for a recent blog post using GPU-Z data logging (see full article HERE):
Interested in trying GPU-Z? You can download it HERE. Have questions about GPU-Z? You can ask questions and find more information HERE.
Find me on twitter here: @GavinGear


